State of Climate Action

Assessing Progress toward 2030 and 2050

Partners:

Snapshot of a Changing Climate

We have already seen a 1°C rise in global average temperature since the Industrial Revolution. This has had major impacts on people (with those most vulnerable disproportionately impacted), ecosystems, and infrastructure. Temperature could increase by more than 3°C, even with full implementation of countries’ climate commitments.

saikiran kesari/Unsplash

Under the Paris Agreement, countries agreed to limit warming to well below 2°C above preindustrial levels and to pursue efforts to limit warming to 1.5°C to avoid the worst impacts of climate change. According to the latest science from the Intergovernmental Panel on Climate Change (IPCC 2018), global greenhouse gas (GHG) emissions will need to be halved by 2030 and reach net zero by midcentury in order to have a good chance of holding temperature increase to 1.5°C.5 The sooner emissions peak and the lower they are at the time of peaking, the greater the likelihood of reaching net-zero emissions in time.

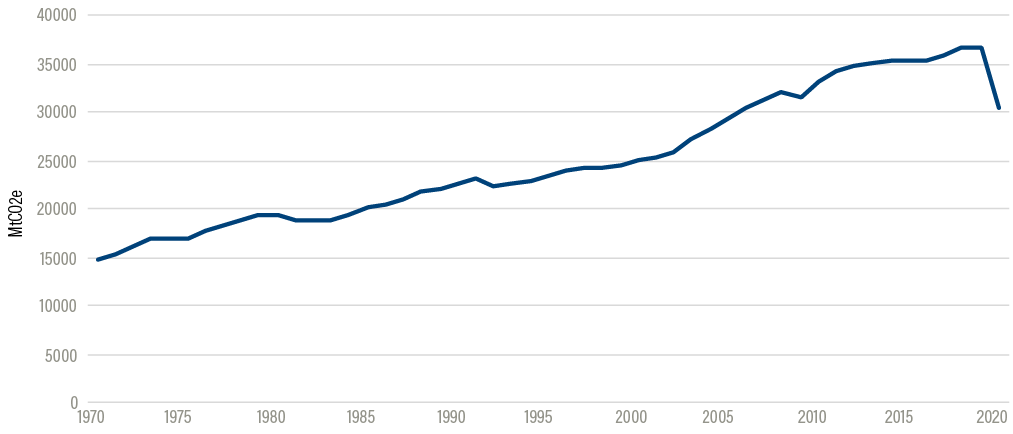
Figure 1 | Global mean temperature rise relative to 1951-1980 (°C)

Note: Data in 2020 shown here are through April only. 
Source: Le Quéré et al. (2020).

Greenhouse gas emissions from fossil fuel combustion, deforestation, and other causes have already resulted in 1.1°C of warming above preindustrial levels (WMO 2020), which has radically altered our climate. The impacts of a changing climate are already bringing catastrophic damage to communities around the world, leading to loss of life, livelihoods, ecosystems, homes, and other infrastructure we depend on. Already as a result of changes in temperature, precipitation, and sea level rise, we are seeing extreme weather events unfold around the world. Recent research confirms that these events are getting more frequent and severe. This year, extreme fires burned 18 million hectares in Australia, and the conditions that sparked and spread the fires were found to be at least 30 percent more likely because of human-induced climate change (Phillips 2020). As of mid-September, 2020’s record-setting fires on the U.S. West Coast had claimed 30 lives, displaced thousands, and burned houses and other infrastructure over more than 5 million acres (Migliozzi et al. 2020).

The odds of drought have increased significantly in the Mediterranean region as a result of human-caused emissions, and heat waves are increasing around the world as temperatures rise (IPCC 2014b). There also is significant evidence that the frequency, intensity, and/or amount of heavy precipitation events have increased due to anthropogenic warming (IPCC 2019a).

A definitive report from the IPCC (2018) found that the world will face severe climate impacts even with 1.5°C temperature rise. Without increased ambition in countries’ climate commitments and climate actions, we can anticipate at least 3˚C of warming by the end of the century (UNEP 2019), which could lead to an almost unrecognizable planet. The world’s most vulnerable people will be most disproportionally impacted (IPCC 2019a), compounding other global challenges and our ability to meet societal goals.

Greenhouse Gas Emissions

While global emissions showed no recent signs of peaking (Levin and Rich 2017), the COVID-19 crisis has led to an unprecedented decline in GHG emissions over the past half year. According to a study in May 2020 (Le Quéré et al. 2020), by early April global daily CO2emissions had declined by 17 percent compared with average 2019 emissions (Figure 1). However, only two months later, by mid-June, as governments and businesses started to reopen, emissions had already returned to 5 percent below 2019 levels (Le Quéré et al. 2020). The choices governments and investors make in the coming months as they plan to rebuild their economies will dictate our emissions trajectory for decades to come. And experience has shown us that emissions reductions caused by economic downturns are only temporary (Peters et al. 2012).

The 2019 UNEP Emissions Gap Report found that emissions need to be halved by 2030 to have a good chance of limiting warming to 1.5°C, which translates to reductions of 7.6 percent per year over the next decade.

Warming Temperatures

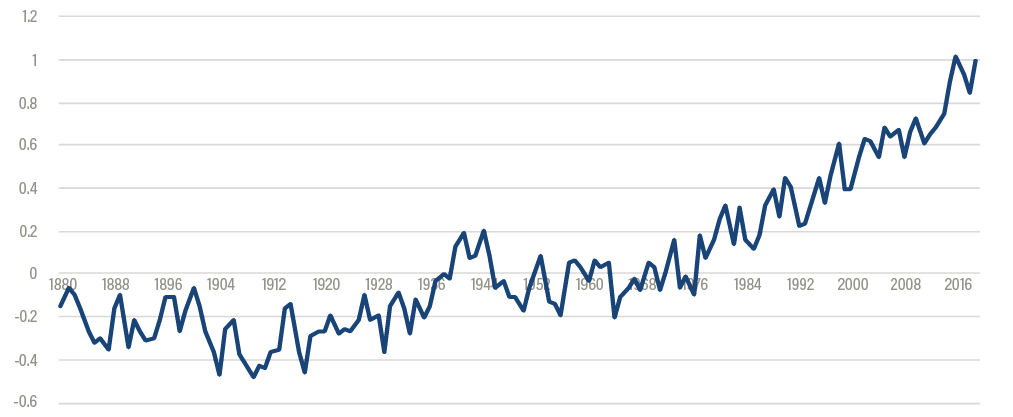
The buildup of greenhouse gases in the atmosphere is rapidly warming the planet. The year 2019 was the second warmest since modern recordkeeping began (NASA 2020c), after 2016. The last five years have been the warmest since the Industrial Revolution (Figure 2). The past decade was the warmest on record, with each decade warmer than the one that preceded it (NASA 2020c). This warming has not been evenly distributed; the poles are warming the fastest.

Figure 2 | Global mean temperature rise relative to 1951-1980 (°C)

Source: Met Office (2019).

Climate Impacts on Ice and Glaciers

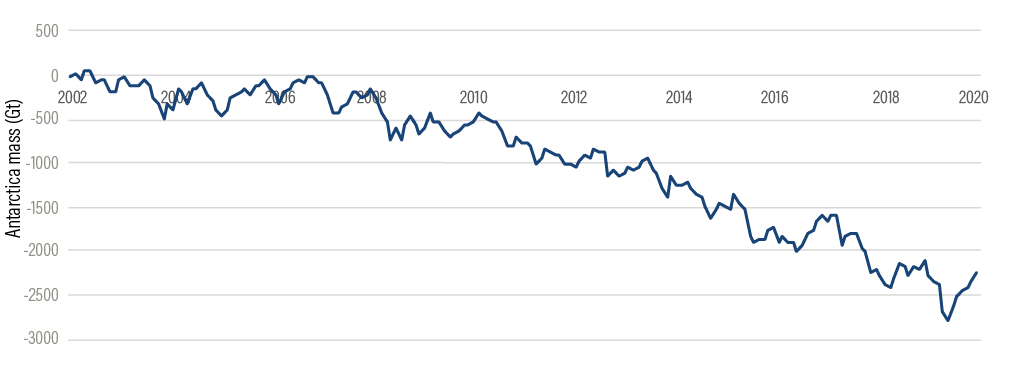
In 2019, Arctic sea ice minimum was the second lowest on record. Ice loss has been accelerating in Greenland and Antarctica (NASA 2020a) (Figure 3). In February 2020, temperatures climbed to 18.3°C (65°F) in Antarctica, its hottest day on record (NASA 2020d). Greenland’s melting in the summer of 2020 was well above average, although not as high as some recent previous summers (NSIDC 2020). In 2019 ice lost from the Greenland Ice Sheet was almost 2.5 times the average annual loss between 2002 and 2019 (Veliconga et al. 2020).

Figure 3 | Antarctic ice mass loss, 2002–20

Source: NASA (2020a).

Glaciers around the world are also losing ice at a rate that is accelerating with each passing year. Per decade, the average loss of liquid water from glaciers nearly doubled from 460 millimeters (18 inches) of liquid water in the 1990s to 850 millimeters (33 inches) in 2010–18 (NOAA 2019).

Climate Impacts on Our Oceans

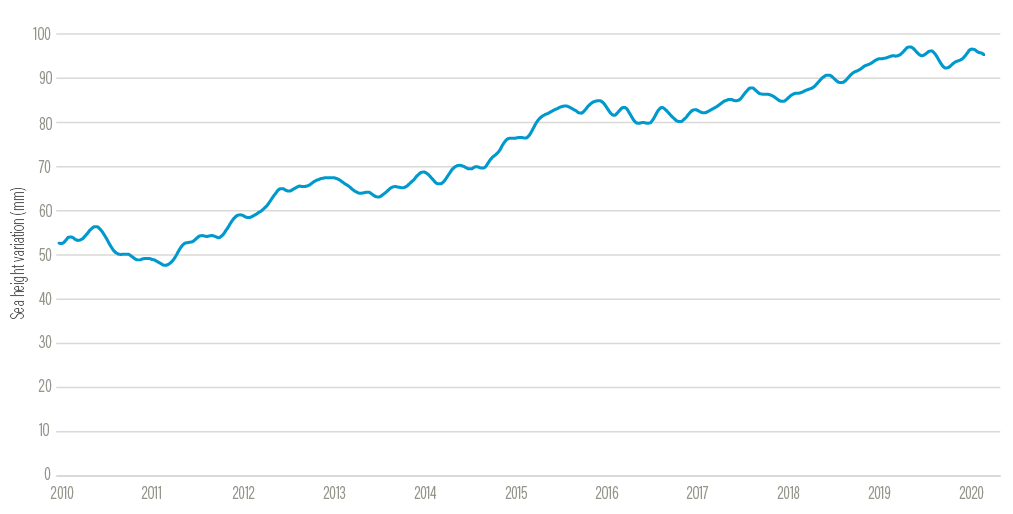
Global mean sea level rise was roughly 3.3 millimeters (mm) per year (0.13 inch/yr) between 1993 and 2020 (Figure 4) (NASA 2020b). This trend accelerated significantly during this past decade: between 2010 and 2018, sea level rise grew to about 4.4 mm/yr (0.17 inch/yr) (NASA 2020b). In 2019, sea level rise reached its highest value on record (WMO 2020).

As oceans absorb almost a quarter of CO2emissions, the ocean has been acidifying, with a decline in pH of 0.017–0.027 per decade since the late 1980s (WMO 2020). The ocean also absorbs 90 percent of the excess heat retained by the earth, and has been warming rapidly. In 2019, the heat content of the ocean reached record highs (WMO 2020). As a result of this heat, this year Australia experienced a new coral bleaching event that is the most widespread on record, and the third major bleaching event in only five years (Kann 2020). The IPCC’s Special Report on the Ocean and Cryosphere in a Changing Climate, documented that marine heatwaves are becoming more extensive, intense, and long-lasting. Large-scale coral bleaching events have become more frequent over the past two decades due to warming (IPCC 2019b).

Figure 4 | Sea level change (mm) since 2010

Source: NASA (2020b).

Start reading