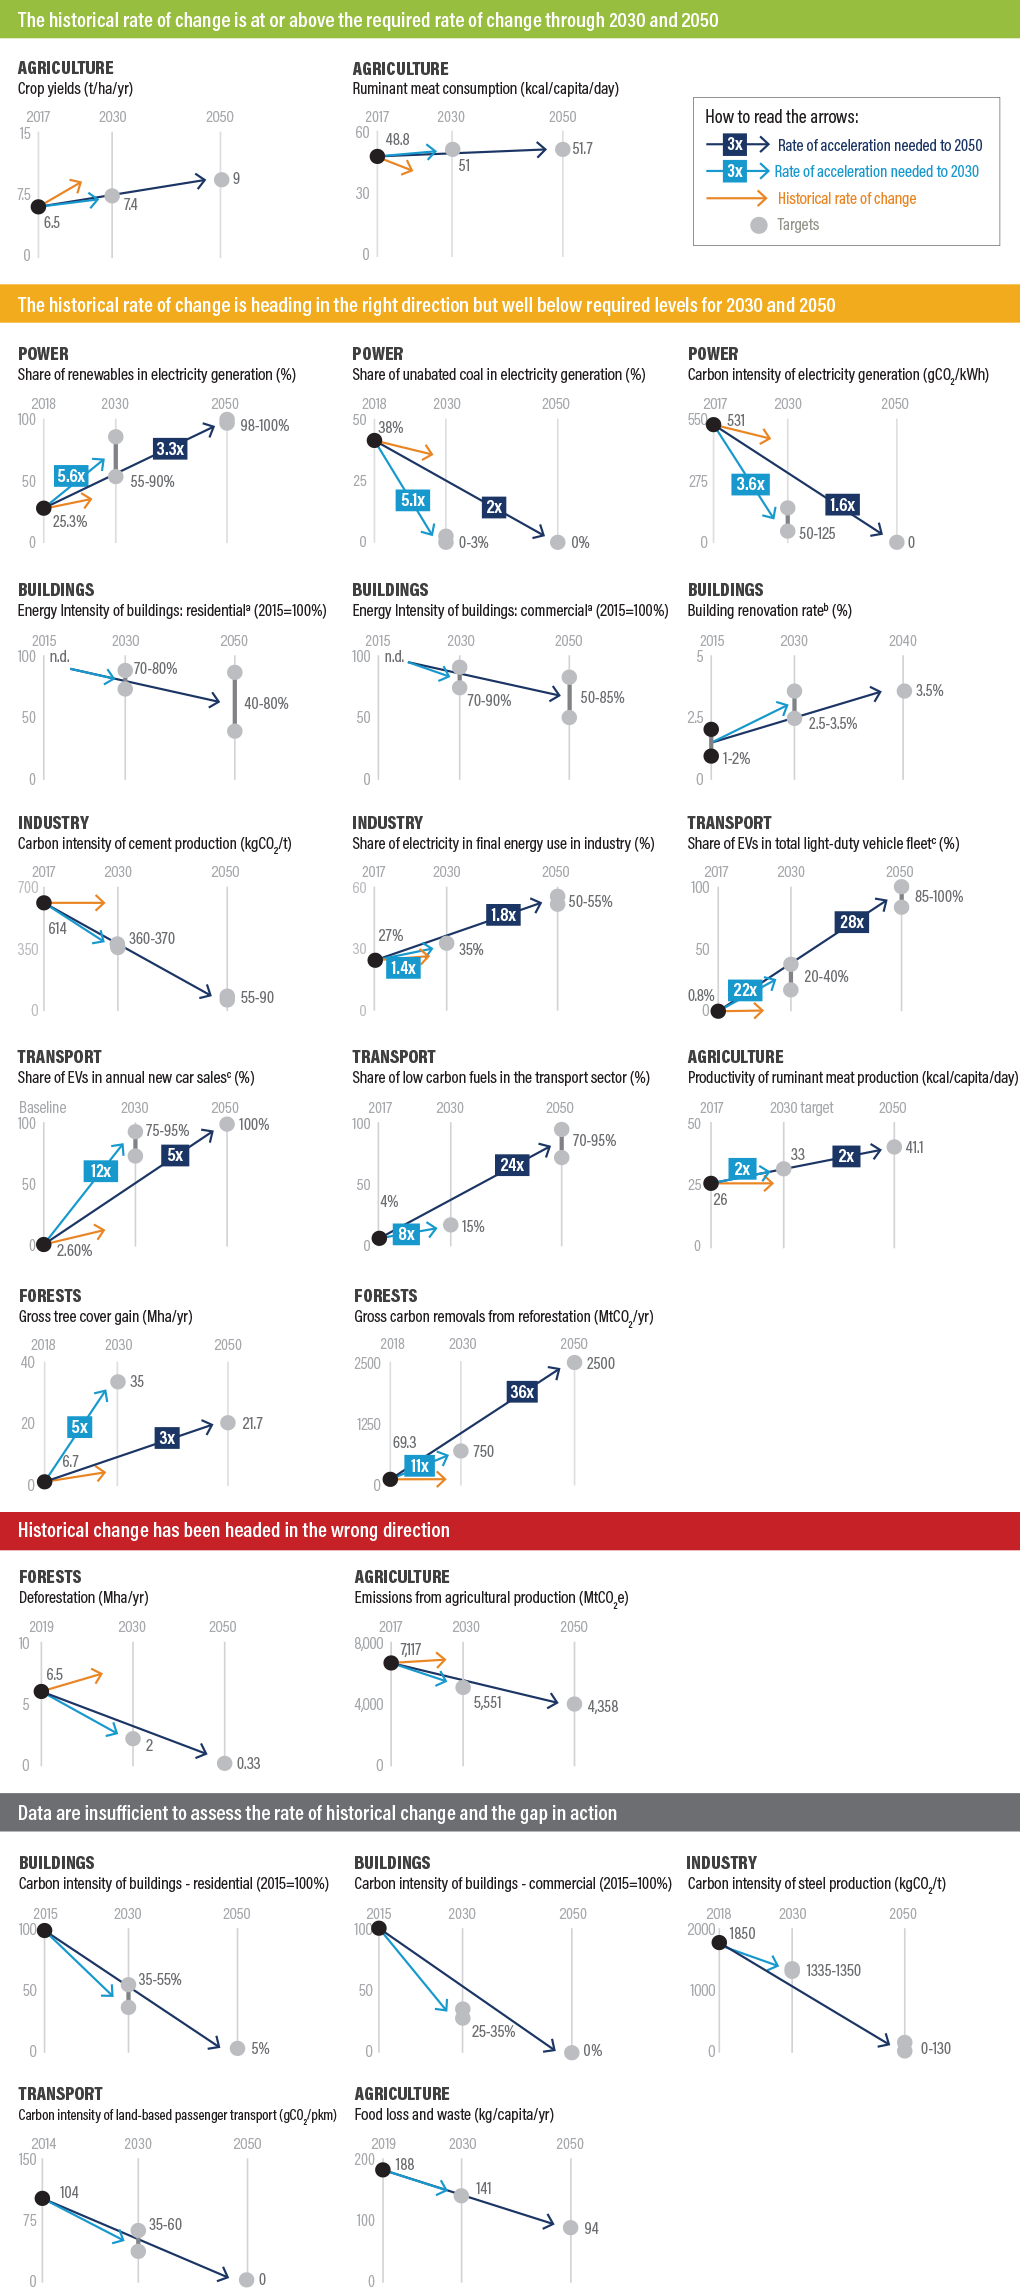
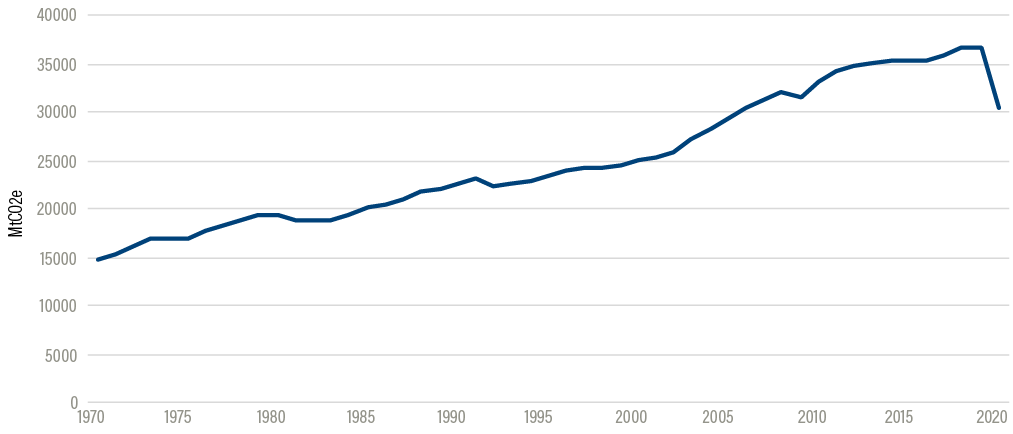
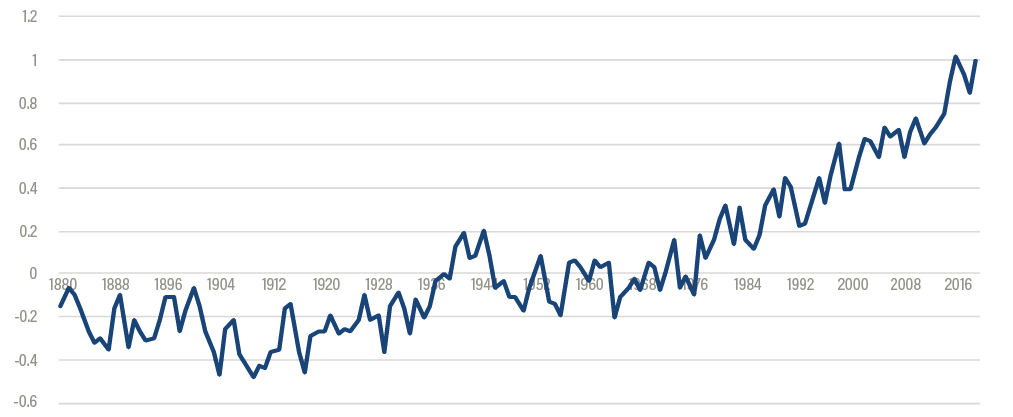
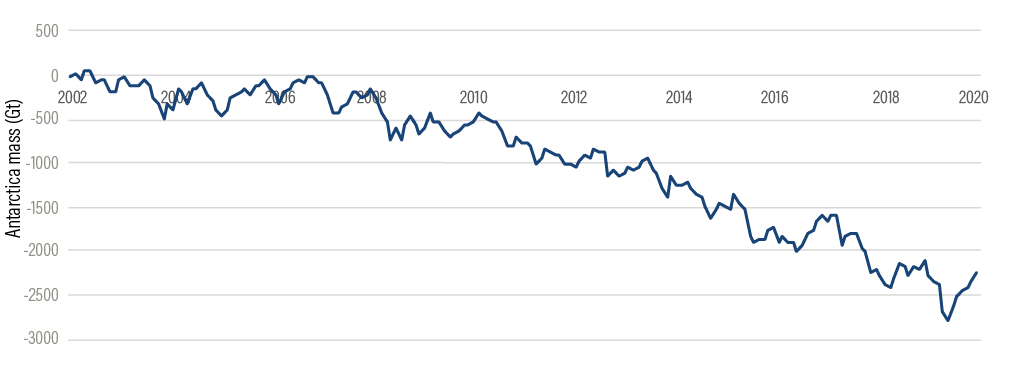
State of Climate Action

Assessing Progress toward 2030 and 2050

Partners:

Assessment of Progress by Sector

Achieving deep decarbonization will require action across all sectors; each one plays a critical role and in some cases can support decarbonization in other sectors as well. The sections in this chapter assess progress on decarbonization in economic sectors by measuring indicators selected for each sector.

ricardo gomez angel/Unsplash

Sectors covered in this report are shown in Figure 14 to illustrate the current share of emissions from each (wedges in gray are not covered in this report). Targets for each indicator are developed at the global level and, for some major emitting countries, at the national level. Indicators and targets for the power, buildings, industry, and transport sectors were developed by the CAT (2020a) consortium, while indicators and targets for the forests and agriculture sectors were developed by WRI. All targets are designed to indicate the action needed to bring the sectors into alignment with a 1.5°C pathway. Global targets often differ from national targets.

Figure 14 | GHG emissions by sector, 2016 (GtCO2e)


Notes: Sectors covered in this report are shown in color; sectors not covered here are in gray.

Emissions from industry come from “Industrial processes” as well as “Energy: Manufacturing and construction.” Cement and steel, the largest emitters for which there are distinct indicators, make up 44 percent of all CO2 emissions in industry (IPCC 2014a).

Emissions in the buildings sector include the wedge labeled “Energy: Buildings,” which includes on-site combustion of energy but not heating and electricity use, which are counted in the “Energy: Electricity/heat” wedge.

Emissions from agriculture do not include land use change and do not include the upward adjustments made and further explained in Table 19.

Source: ClimateWatch (2020b).

The power (electricity generation) sector13 has historically been, and continues to be, the single-largest emitting sector, producing 30 percent of global greenhouse gas emissions (or 15.6 GtCO2e) in 2016 (ClimateWatch 2020b), and emissions continue to increase due to rising electricity demand. Energy infrastructure—power plants, transmission lines, substations—has long life cycles, and planned and in-construction coal plants pose by far the largest risk to locking us into a world where temperature rise exceeds 1.5°C (Seto et al. 2016). For newly built large-scale power plants, we only have one replacement cycle left before 2050, unless plants are retired early, making movement away from fossil fuel–powered electricity systems more urgent now than ever (Williams et al. 2014). Assuming historical lifetimes and utilization, currently operating fossil fuel power plants would use up 62 percent to 85 percent of our 1.5°C carbon budget.14 If we include proposed plants, we will use 94 percent to 130 percent of the budget (Tong et al. 2019). The required early retirements of fossil fuel power plants increase the risk of stranded assets, through which investors face $1 trillion to $4 trillion in losses (Mercure et al. 2018).

The case for shifting to renewable sources of energy is clear when we look at their many benefits to economic development, human health, and climate-impact risk reduction. A transition away from fossil fuel–based electricity production can reduce air pollution and water consumption, offer cost-efficient energy access, provide more jobs, and increase the resilience of the power sector to climate impacts (NCE 2018).

Given the past and future expected decrease in the cost of renewables, the International Renewable Energy Agency (IRENA) estimates that replacing the costliest 500 gigawatts of coal power plants with solar and wind would save up to $23 billion per year ($244 billion to $463 billion over 20 years) and yield a stimulus worth around 1 percent of global GDP (IRENA 2020c). For every $1 spent on this transformation, we could receive up to $7 in return benefits (IRENA 2018a).15

Getting to a net-zero energy sector (including transport and buildings) will require us to electrify, optimize, and decarbonize. This means we need to switch the transport and buildings sectors to electricity, while also investing in energy efficiency to reduce overall demand. At the same time we need to decarbonize the electricity sector through the deployment of renewables. We examine this transition through two indicators—share of renewables and share of unabated coal in electricity generation, which will in turn drive the overall carbon intensity of electricity generation.

Indicator 1: Share of renewables in electricity generation (%)

2030: share of renewables increases to 55–90 percent

2050: share of renewables increases to 98–100 percent

Emissions from the power sector are driven by coal-, oil-, and gas-fired power plants, with coal being the biggest offender in terms of emissions per unit of electricity produced. To reduce emissions to net zero by 2050, we will need to rapidly replace fossil fuel generation with renewables (hydro, geothermal, solar, wind, tide, wave, and biofuels) and at the same time slow the growth of electricity demand through energy efficiency to enable even more rapid replacement.

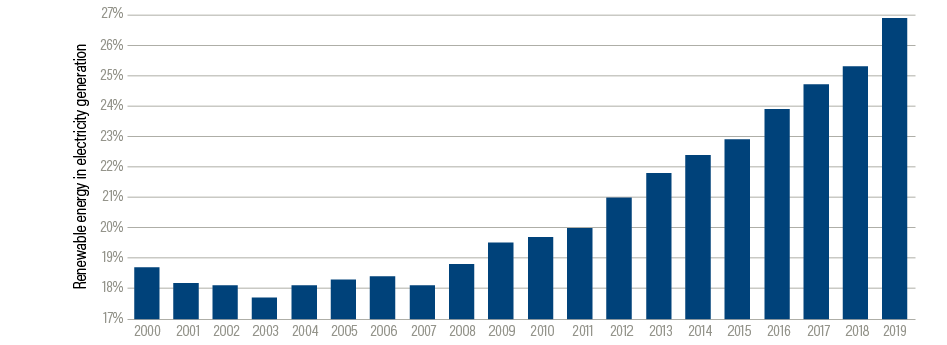
The unprecedented decline in the price of renewable generation technologies and battery storage has driven adoption of renewables as the global power generation technology of choice. The share of renewables in global electricity generation has increased from 19.7 percent in 1990 to 25.3 percent in 2018 (IEA 2020g).16 For 2019, we see an increase to 26.9 percent or 27.3 percent, the highest annual increase in renewable share to date (IEA 2020j; REN21 2020) (Figure 15).

Figure 15 | Share of renewables generation, showing acceleration of annual increase, 2000–19

Note: Y axis ranges from 17 percent to 27 percent to clearly show acceleration of growth.

Source: Calculated based on IEA (2020g).

In 2019 renewables accounted for 72 percent of new capacity additions worldwide (IRENA 2020b) (Figure 16). The IEA predicts that this trend will continue, and IRENA (2018b) projects that in 2020, three-quarters of wind and four-fifths of solar photovoltaic (PV) projects will be cheaper than fossil fuels, even without financial assistance. The increase in renewable generating capacity in recent years has surpassed previous projections, showing that renewable deployment has started to accelerate, and indicating the start of an S-curve transformation.

Figure 16 | Growing share of renewables in annual additions to global installed generating capacity, 2001–19


Source: IEA (2019a).

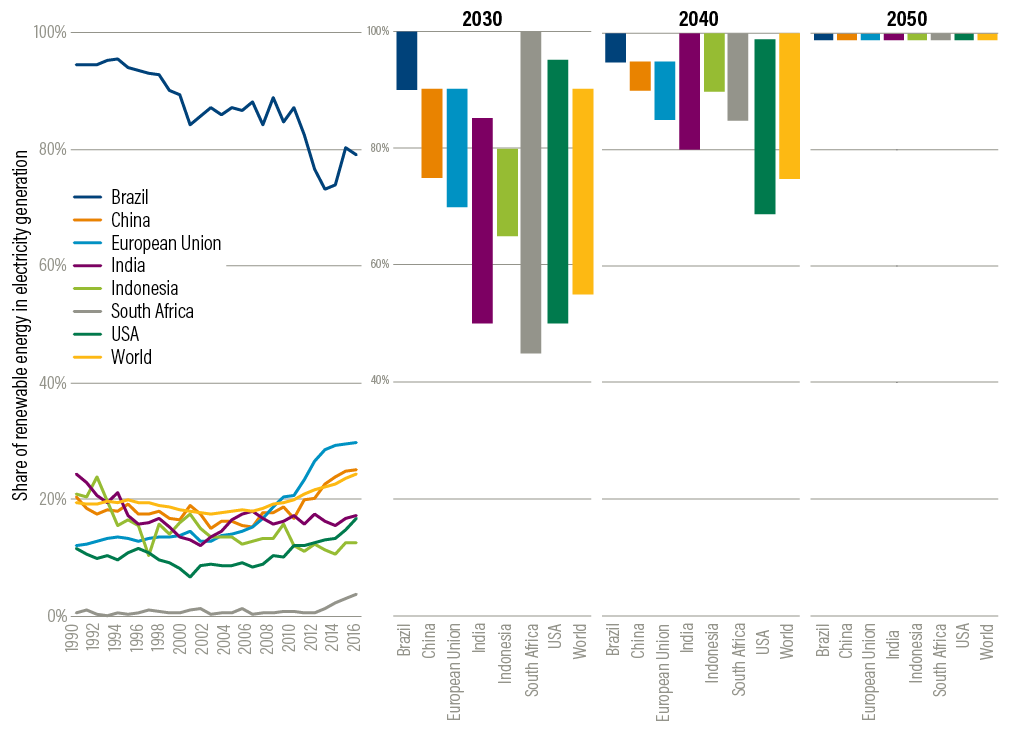
As electricity demand continues to grow in many parts of the world, the speed at which renewables replace existing fossil fuel power plants must accelerate to achieve targets that are aligned with a 1.5°C pathway.17 Figure 17 shows that renewables would need to grow at an unprecedented rate to reach 98–100 percent by 2050.

The targets have upper and lower bounds for 2030, 2040, and 2050 and represent the highest plausible ambition. Other scenarios by integrated assessment models, as well as IRENA (2020a), show ranges below 100 percent in 2050. IPCC (2018) shows the possible range of electricity supplied by renewables at 59–97 percent in 2050 for a 1.5°C pathway.

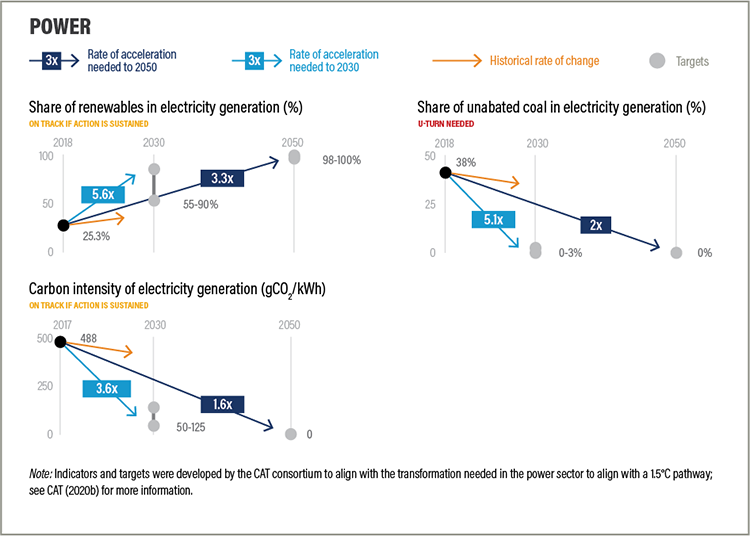
While data from REN21 (2020) show that renewable capacity had its largest increase ever (200 GW) in 2019, we are not on track to meet the 2030 and 2050 targets. We have seen a global annual increase of renewables share of 0.7 percent per year in the last five years and will need to accelerate this growth 5.5 times to reach the 2030 target and 3.3 times for the 2050 target.

By 2040, the IEA’s scenarios expect 44 percent of power to come from renewable generation under current policies and 67 percent from renewable generation under the IEA’s sustainable development scenario (IEA 2019b). Both of these percentages are lower than what is needed to stay under 1.5°C temperature rise. However, the IEA’s scenarios are often seen as conservative, and the cost reductions and rapid growth of renewables have outpaced its previous scenarios (Evans 2019) (Figure 18), so it is possible that actual growth rates will exceed what is laid out in IEA scenarios, as they have done in the past.

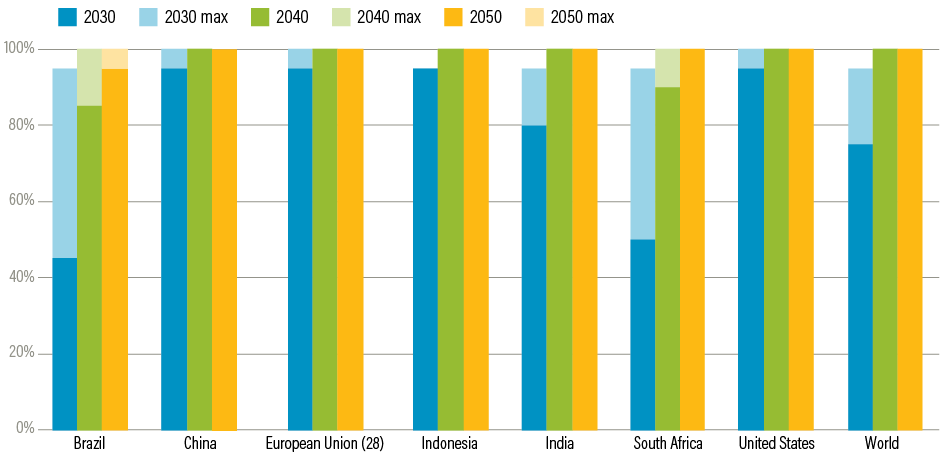
At the national level, we need a similar level of ambition. Most countries have slowly increased the share of renewables in their energy mix since 2005. However, to be aligned with a 1.5°C pathway major emitters will need to ramp up to a minimum of 45 percent power generation from renewables by 2030; 75–100 percent by 2040; and 98–100 percent by 2050 (Table 1).

The targets have upper and lower bounds for 2030, 2040, and 2050 and represent the highest plausible ambition. Other scenarios by integrated assessment models, as well as IRENA (2020a), show ranges below 100 percent in 2050. IPCC (2018) shows the possible range of electricity supplied by renewables at 59–97 percent in 2050 for a 1.5°C pathway.

Figure 17 | Historical (1990–2017) and target (2030, 2040, 2050) share of renewable energy in electricity generation by region

Note: Targets have upper and lower bounds for 2030, 2040, and 2050. Targets represent the highest plausible ambition. Other scenarios by integrated assessment models, as well as IRENA (2020a), show ranges below 100 percent in 2050. IPCC (2018) shows the possible range of electricity supplied by renewables at 59–97 percent in 2050 for a 1.5°C pathway. Brazil’s historical share is high due to the country’s high use of hydroelectric power.

Source: Calculated based on IEA (2020g), CAT (2020a).

While the increase in global power generation is mostly driven by growth in India and China, these countries have also met a lot of their new demand with renewables and are major investors in renewables, with China representing 32 percent of investments in 2018 (IRENA 2020b).

Figure 18 | Decreases in solar and wind power generation technology prices, indexed to 2009, and battery storage prices, indexed to 2010


Notes: PV = photovoltaic; LCOE: levelized cost of energy.

Renewables’ cost reduction has helped these technologies compete in major markets. Solar PV prices have seen the biggest drop, with PV modules only costing about one-tenth of their price in 2009. An often-overlooked success story has been the improvements in battery technology, a key requirement for renewable energy storage. Tesla, General Motors, and Volkswagen all announced that they will have prices down to $100/kWh in the course of 2020, which would be another 50 percent reduction compared to 2019 prices (Ewing 2020; Holland 2018; Beresford 2020). At the same time, battery energy density has almost tripled, making batteries smaller, lighter, and more suitable for a variety of uses.

Sources: Lazard (2020); BNEF (2020b).

Table 1 | Share of renewables in electricity generation, historical trends, and change needed to achieve 2030 and 2050 targets

Country

2018 Share of Renewables (%)

2030 Highest Possible Ambition (%)

2050 Highest Possible Ambition (%)

Historical Average Annual Change, 2013–18 (%)

Average Annual Change Target, 2018–30 (%) (Range)

Average Annual Change Target, 2018–50 (%) (Range)

Brazil

82.3

90 to 100

98 to 100

1.1

0.6 to 1.5

0.5 to 0.6

China

26.0

75 to 90

98 to 100

1.1

4.1 to 5.3

2.3

European Union (28)

32.3

70 to 90

98 to 100

1.1

3.1 to 4.8

2.1

India

18.9

65 to 80

98 to 100

0.3

3.8 to 5.1

2.5

Indonesia

17.2

55 to 85

98 to 100

1.0

3.1 to 5.7

2.6

South Africa

6.6

45 to 100

98 to 100

1.0

3.2 to 7.8

2.9

United States

17.0

50 to 95

98 to 100

0.8

2.8 to 6.5

2.6

World

25.3

55 to 90

98 to 100

0.7

2.5 to 5.4

2.3

Global acceleration needed


5.6x to 2030

3.3x to 2050

Notes: Renewables include electricity from hydro, geothermal, solar, wind, tide, wave, biofuels, and the renewable fraction of municipal waste.

For biofuels, modeling scenarios do not often account for full lifecycle emissions (e.g., from the production and gathering of biomass feedstocks). Especially where the production of feedstocks causes direct and indirect land use change, proper accounting of these lifecycle emissions could reduce the range of biofuels. Similarly historical renewable shares include 1.9 percent biofuels, which might not be zero-carbon.

Acceleration factors are averaged where the targets include a range.

The Climate Action Tracker targets are set at the highest level of ambition that is technically achievable based on national energy transition studies. Integrated assessment models build scenarios for the whole economy (not just the power sector) across all countries and come to a wider range of share of renewables (71–95 percent) across the above countries. This indicates that there are 1.5°C-compatible scenarios with a renewable penetration of less than 98–100 percent.

Sources: IEA (2020g); CAT (2020a).

Global demand for electricity will continue to grow as other sectors, like transport and buildings, are electrified, which will require even more renewable generating capacity. Globally, investments in renewables increased rapidly in the first decade of the century and then stayed relatively constant between 2011 and 2018 (Figure 19). However, because of declining prices, new installed capacity of renewables still increased from 109 GW in 2011 to 200 GW in 2019 (REN21 2020). Investments in grid flexibility will also be critical to achieving a high percentage of renewables in the grid.

Figure 19 | Public and private investment in installed capacity of renewable electricity generation


Source: IRENA (2020b).

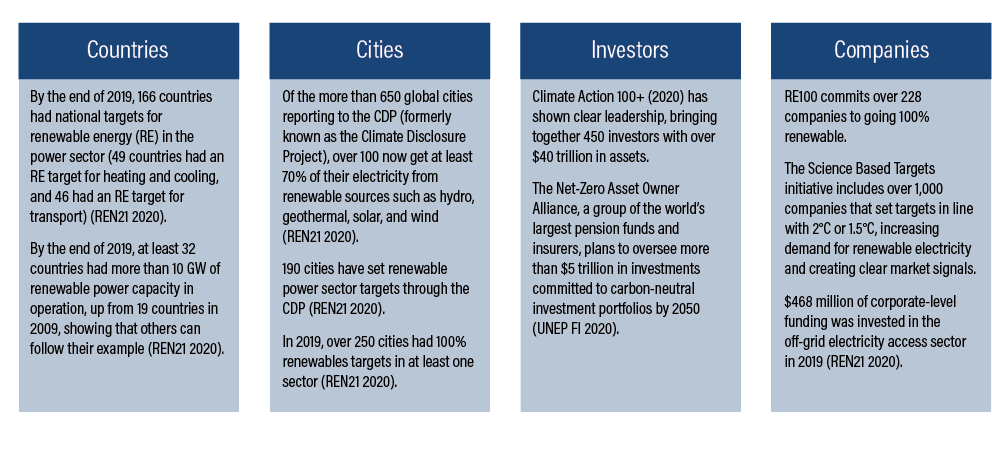
Many changes on the ground indicate that we are reaching a tipping point for renewable energy generation and energy storage, driven mostly by cost reductions (Figure 17) but also by policies, political signals, and increased demand from electricity consumers, investors, and companies. Action on renewables takes place at all levels, with the private sector playing a key role in driving renewable deployment (Figure 20). However, we need to see rapid change in the coming years to shift from the continued buildout of fossil fuel power plants that risks locking us into a pathway incompatible with the 1.5°C goal. To achieve the necessary high proportion of renewables in global power generation, we simultaneously require better system integration and expansion of electricity storage.

Figure 20 | Climate actions and commitments by different actors

Private sector actions show that the markets are ripe to drive this transition. India’s largest electric utility company, Tata Power, announced that most of its future capacity will be renewables, and similar commitments have been made in Spain and the United States in 2019 (REN21 2020). The private sector can show continued ambition by target-setting at the portfolio level and reporting on progress,18 and large energy consumers can set ambitious renewable targets through the Science Based Targets initiative.

Government policies still run counter to the trajectory of private sector action in some cases. For example, recent policy uncertainties in China and India and tax changes in Spain contributed to slowdowns in the national solar PV market in those countries. The request to Parties to submit new and enhanced nationally determined contributions (NDCs) over the coming year gives governments the opportunity to send strong market signals. Most NDCs are not in line with a 1.5°C pathway and do not recognize the potential for increased renewable deployment, as well as energy efficiency, grid flexibility, and other measures that would help enhance action in the sector.

Several additional actions by governments can accelerate private sector adoption and investment. Fossil fuel subsidies, estimated to be double those of renewable energy in 2016, can be reduced and eliminated (NCE 2018). Governments can expand effective carbon pricing, enact additional policies to integrate variable renewable energy in supply-and-demand systems (REN21 2019), expand distributed renewable electricity to the 860 million people without access to electricity (REN21 2020), invest in energy efficiency (REN21 2019), and implement utility reform to better address demand by renewable energy customers.

Indicator 2: Share of unabated coal in electricity generation (%)

2030: 0–2.5 percent unabated coal in electricity generation

2050: zero unabated coal in electricity generation

Coal has the highest emissions intensity of all electricity sources and presents the highest risk of locking us into a pathway above 1.5°C of temperature rise (Seto et al. 2016). All scenarios that limit warming to 1.5°C nearly phase out unabated coal (coal power plants that do not use carbon capture and storage, or CCS)19 by 2030 and have no remaining coal capacity by 2040. The average life cycle of a coal-fired power plant is 45 years (Erickson et al. 2015), which means we need to retire recently built power plants early and stop building new ones altogether. To stay within 1.5°C, average lifetimes of coal plants might need to be reduced to 20 years instead (Cui et al. 2019). Most countries have maintained a stable share of coal in their generating capacity over the last 20 years and will need to rapidly retire nearly all unabated coal-fired plants and replace them with non–fossil fuel plants. Widespread use of CCS in coal electricity generation faces an uncertain future as there are currently no large-scale, commercially viable options, but CCS could be one possible solution to reduce absolute emissions and reduce the carbon intensity of the electricity sector to zero, particularly beyond 2030 (see Indicator 3).

Figure 21 | Historical trends and required declines (two scenarios) in share of coal in electricity generation


Sources: CAT (2020a, 2020b); calculated based on IEA (2019a).

Figure 21 shows historical trends in coal-fired power generation and two projected pathways toward the target of zero unabated coal in the power sector’s energy mix by 2030. Table 2 spells out how far we have to go.

In line with the increased use of renewables, we have seen a global annual coal share decrease of 0.6 percent per year in the last five years. We will need to accelerate this decrease 5.2 times, however, to reach the 2030 target and 3.6 times for the 2050 target.

The falling cost of renewables, countries’ national climate commitments (or NDCs) and policies, as well as public health benefits have led many governments to recognize that coal is becoming economically untenable and socially unfavorable (IRENA 2018a). By April 2020, 33 national governments, 27 subnational governments, and 37 businesses had joined the Powering Past Coal Alliance (PPCA 2020), committing themselves to accelerating the transition from coal to clean energy.

At least 28 major banks have stopped direct financing to new coal plants worldwide (BankTrack 2020). Additionally, over 1,110 institutions with more than $11 trillion in assets committed to divesting from fossil fuels, compared to just $52 billion in 2014 (Cadan et al. 2019).

Table 2 | Share of coal in electricity generation in 2017 and targets for 2030 and 2050

Country

Share of Coal in Electricity Generation, 2018 (%)

2030 Target (%)

2050 Target (%)

Historical Average Annual Change, 2013–18 (%)

Average Annual Change Target, 2018–30 (%)

Average Annual Change Target, 2018–50 (%)

Brazil

3.9

0

0

0.01

-0.3

-0.1

China

66.5

5 to 10

0

-1.7

-5.1 to -4.7

-2.1

European Union (28)

20.1

0

0

-1.5

-1.7

-0.6

India

73.5

5 to 10

0

0.1

-5.7 to -5.3

-2.3

Indonesia

56.4

5 to 10

0

1.0

-4.3 to -3.9

-1.8

South Africa

88.8

0 to 35

0

-0.8

-7.4 to -4.5

-2.8

United States

28.6

0

0

-2.2

-2.4

-0.9

World

38.0

0 to 3

0

-0.6

-3.2 to -2.9

-1.2

Global acceleration needed


5.1x to 2030

2.0x to 2050

Note: Acceleration factors are averaged where the targets include a range.

Sources: Calculated based on IEA (2019a, 2020a); CAT (2020b).

Despite these commitments, new coal capacity20 has not sufficiently slowed down in recent years. In 2019 the addition of new coal was double the capacity that was retired (68 GW added; 34 GW retired) (Figure 22). While coal plant retirements have increased from just 2 GW in 2006, this is still vastly outside the necessary trajectory, given that most coal plants will need to be retired by 2030.

Figure 22 | New coal capacity and retirements, 2006–19


Source: CoalSwarm (2020).

Between 2010 and 2019, 1,523 GW of planned coal plant capacity was canceled (by comparison, about 2,000 GW is currently in operation), and about 800 GW of coal capacity is still in the pipeline as of January 2020. Capacity is mostly being added in India and China (76 percent of new additions in 2019) to meet increasing demand (CoalSwarm 2020).

Indicator 3: Carbon intensity of electricity generation (gCO2/kWh)

2030: Reduce carbon intensity by 74–90 percent (50–125 gCO2/kWh from 506 gCO2/kWh in 2018)

2050: Reduce carbon intensity by 100 percent

Carbon intensity, which describes the amount of CO2emitted per unit of electricity produced, is the main metric used to track how fast we are decarbonizing the power sector. The combination of energy sources used to generate electricity, including renewables, coal, oil, and gas, as well as the use of biomass with carbon capture and storage (BECCS), determines the sector’s carbon intensity. The use of BECCS is uncertain, as it is not commercially available and can impact other sectors, like agriculture and forests through land area competition.

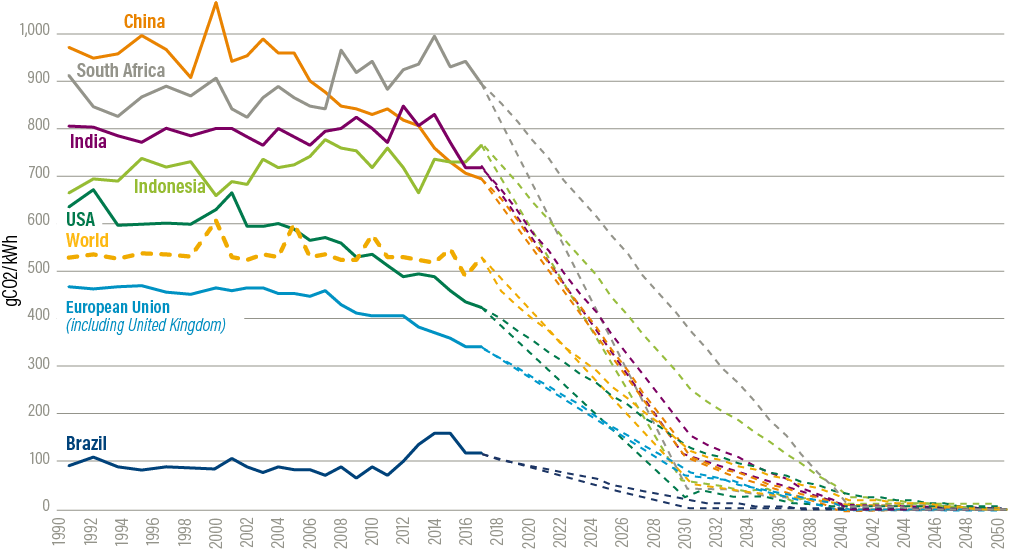
Figure 23 shows historical trends in the carbon intensity of electricity generation and two scenarios for achieving the targeted intensity declines over the next 30 years. Table 3 spells out how far we have to go.

To limit warming to 1.5°C we will need to reduce the global carbon intensity to below zero in 2050, but we have not seen much progress toward this target in the last 30 years. Global carbon intensity of electricity was 482.9 gCO2/kWh in 2017, only a small reduction from the 528.6 gCO2/kWh in 1990 (IEA 2020g).

Figure 23 | Historical trends and required decline (two scenarios) in carbon intensity of the power sector

Sources: CAT (2020a); calculated based on IEA (2019a).

To achieve the benchmarks we will need to accelerate this decrease 3.6 times to reach the 2030 target and 1.6 times for the 2050 target.

Table 3 | Carbon intensity of electricity generation in 2017 and target reductions for 2030 and 2050 (gCO2/kWh)

Country

2018

2030 Target Range

2050 Target

Historical Average Annual Change, 2010–17a

Average Annual Change Target, 2017–30 (Range)

Average Annual Change Target, 2017–50

Brazil

116.6

0 to 20

<0

4.1

-7.4 to -9.0

-3.5

China

699.5

100 to 110

<0

-19.4

-45.3 to -46.1

-21.2

European Union (28)

341.1

75 to 80

<0

-9.8

-20.1 to -20.5

-10.3

India

718.1

115 to 155

<0

-12.4

-43.3 to -46.4

-21.8

Indonesia

768.5

50 to 255

<0

6.6

-39.5 to -55.3

-23.3

South Africa

899.6

45 to 377

<0

-6.6

-40.2 to -65.7

-27.3

United States

427.5

30 to 130

<0

-15.9

-22.9 to -30.6

-13.0

World

531.2

50 to 125

<0

-7.2

-31.2 to -37.0

-16.1

Global acceleration needed


4.7x to 2030

2.2x to 2050

Note: Acceleration factors are averaged where the targets include a range.

Sources: Calculated based on IEA (2019a); CAT (2020b).

With growing demand for electricity from other sectors like transport and industry, we must switch from all fossil fuel–fired power generation to renewable generation. A key challenge is that fossil fuel subsidies are still double the support that renewable energy receives (REN21 2019), which increases investments in fossil fuels and depletes government funding. The expansion of renewables (Indicator 1) and retirement of coal (Indicator 2) are interlinked and will drive reductions in emission intensity, but we also need to reduce our reliance on oil and gas. Opportunities for action that address climate change and provide jobs and economic growth include investment in flexible grids, energy efficiency, and expansion of renewables as part of the stimulus packages being implemented in response to the coronavirus pandemic.


Decarbonizing residential, commercial, and industrial buildings is a crucial part of keeping global warming below 1.5°C. Building construction and operation are major energy consumers and GHG emitters. Globally, buildings account for 30 percent of energy use, 27 percent of energy-related CO2emissions, and around 20 percent of GHG emissions (Figure 24). If we include the energy consumption and emissions from manufacturing of building construction materials,21 the sector accounted for the largest share of energy use and emissions in 2018 (GlobalABC et al. 2020). In this section, the targets focus on the emissions and energy intensity from building operations, as well as deep renovation of existing buildings. The construction industry is covered by the cement and steel targets in the Industry section.

Figure 24 | The buildings sector’s share of global energy consumption and CO2 emissions, 2018


Note: “Construction industry” (left chart) refers to energy associated with manufacturing building construction materials such as steel, cement, and glass. “Indirect” emissions (right chart) refer to emissions associated with electricity generation. Emissions presented here cover energy-relevant CO2 emissions only and are allocated to end-use categories.

Source: GlobalABC et al. (2019).

Population growth and urbanization have rapidly increased demand for energy in buildings, especially electricity. It is estimated that energy consumed in residential and commercial buildings will increase by 65 percent between 2018 and 2050 (EIA 2019). Improving building energy performance not only can save energy and reduce emissions but also can bring economic benefits such as savings in operational energy costs and reduced demand-side pressure on the power sector, as well as social benefits such as improved comfort and quality of life.

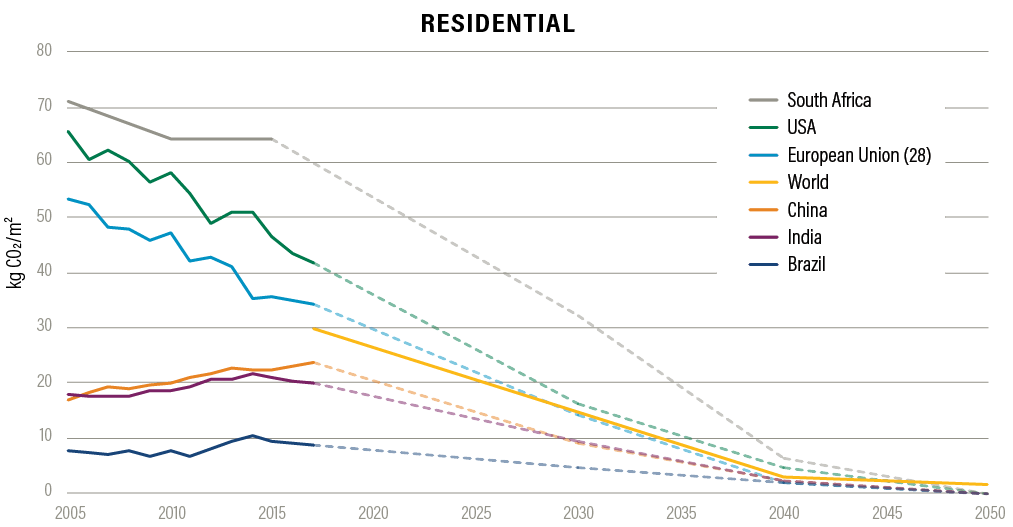
Figure 25 | Historical trends and required decline in the carbon intensity of residential buildings

Note: No data available for Indonesia.

Source: CAT (2020b).

Decarbonization of the buildings sector can only be achieved with measures taken throughout the building life cycle, including constructing new buildings to net-zero or near-net-zero emissions standards using construction materials with low embodied carbon, improving the energy efficiency of existing buildings through retrofit and improved appliance efficiency, as well as decarbonizing the power grid (GlobalABC et al. 2020). Policies that regulate the energy performance of buildings need to be introduced to encourage new and existing buildings to be built and renovated to the highest standards. Building codes are being introduced in an increasing number of countries.

Indicator 1: Carbon intensity of buildings (kgCO2/m2)

2030: residential buildings 45–65 percent lower than 2015 levels; commercial buildings 65–75 percent lower than 2015 levels in select regions

2050: residential and commercial buildings 95–100 percent lower than 2015 levels

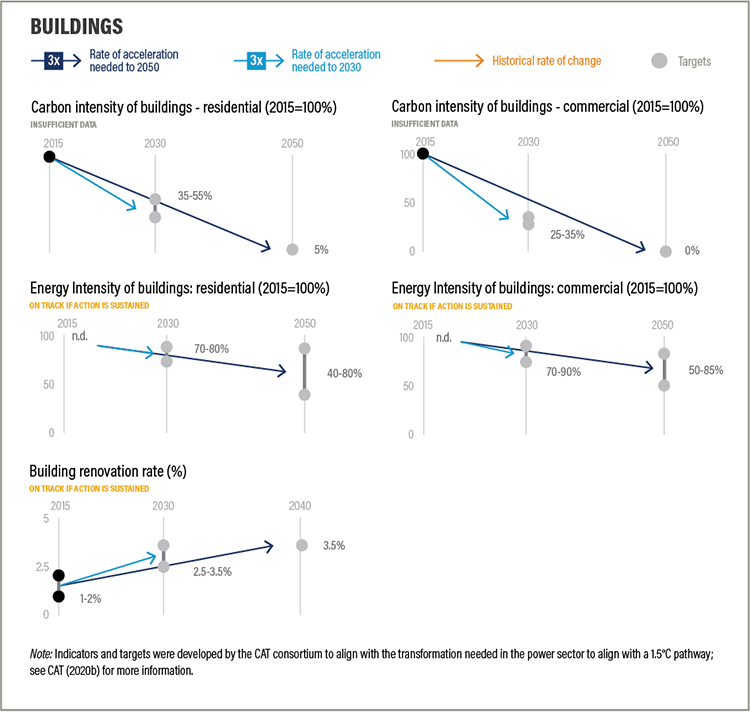
The carbon intensity of buildings is measured in terms of kilograms of carbon dioxide emitted per square meter of floor area (kgCO2/m2) from building operations. It is thus a measure of decarbonization of the energy supply to buildings, although efficiency gains also play an important role in reducing emissions. The targets for carbon intensity imply that by 2050, almost all buildings will operate at net-zero or near-net-zero carbon emissions. Figures 25 and 26 show historical trends and projected declines in the carbon intensity of residential and commercial buildings, respectively, that will be necessary to achieve the 2030 and 2050 targets. Tables 4 and 5 spell out how far we have to go. Globally, building-related CO2emissions were again on a rise in 2017–18 after leveling off in 2013–16 (GlobalABC et al. 2019). It is important to note that with floor area and population projected to continue to increase, it is crucial to reduce overall emissions from the buildings sector in addition to intensity improvements.

Decarbonization of the buildings sector is closely tied to decarbonizing the fuels used in buildings for lighting, heating, cooking, and cooling. A decarbonized power grid is thus a prerequisite for decarbonizing a building’s operations associated with electricity consumption. The carbon emissions of a building’s operations could also be reduced by meeting energy demand with on-site zero carbon or near-net-zero carbon renewable energy, such as solar thermal heating and geothermal heating, as well as an alternative low-carbon energy source (renewable or electric) for cooking, cooling, and heating.

Figure 26 | Historical trends and required declines in the carbon intensity of commercial buildings


Note: No data available for Indonesia.

Source: CAT (2020b).

Indicator 2: Energy intensity of buildings (kWh/m2)

2030: residential buildings 20–30 percent lower than 2015 levels; commercial buildings 10–30 percent lower than 2015 levels in select countries and regions

2050: residential buildings 20–60 percent lower than 2015 levels; commercial buildings 15–50 percent lower than 2015 levels in select countries and regions

The energy intensity of buildings is measured in kilowatt-hours per square meter (kWh/m2). It is thus a measure of the efficiency with which energy is used in buildings. Space cooling has become the fastest growing end use of energy in buildings, and the energy intensity of buildings in hot regions has been increasing due to greater cooling demand (GlobalABC et al. 2019). By comparison, globally, energy intensity has been improving in space heating and lighting, and has remained steady for water heating, cooking, and appliances (GlobalABC et al. 2019). Total energy consumption, however, has been on the rise as increased activities outpace efficiency gains (IEA 2020h).

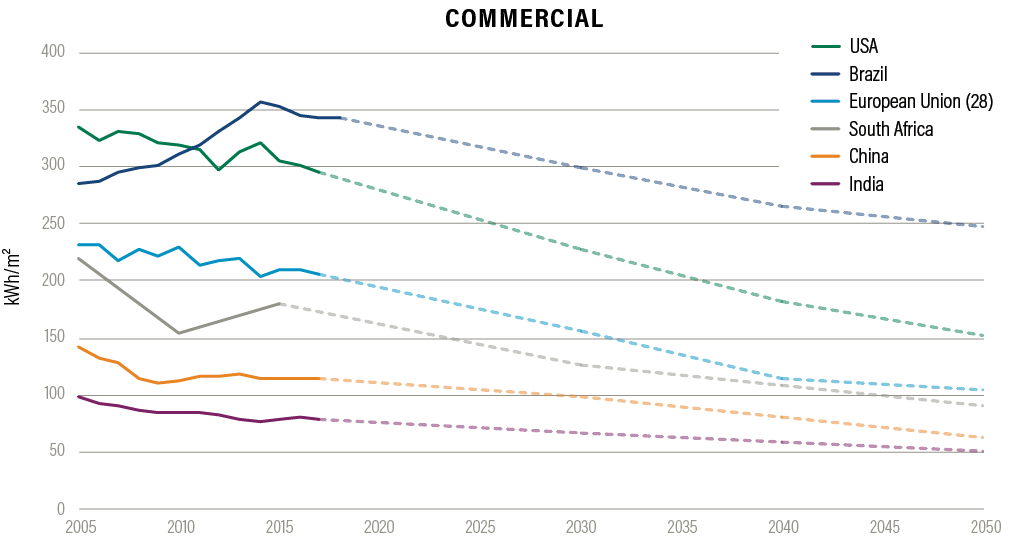
Figures 27 and 28 show historical trends and projected declines in the energy intensity of residential and commercial buildings, respectively, that will be necessary to achieve the 2030 and 2050 targets.

Table 4 | Carbon intensity of residential buildings in 2015 and target reductions for 2030 and 2050 (kg CO2/m²)

Country

2015a (kgCO2/m2)

2030 Target (% Change from 2015 Levels)

2050 Target (% Change from 2015 Levels)

Historical Average Annual Change, 2012–17 (kgCO2/m2)

Average Annual Change Target, 2015–30 (kgCO2/m2)

Average Annual Change Target, 2015–50 (kgCO2/m2)

Brazil

9

-50

-95 to -100

0.2

-0.3

-0.2 to -0.3

China

22

-60

-100

0.4

-0.9

-0.6

European Union (28)

36

-60

-100

-1.7

-1.4

-1.0

India

21

-45 to -55

-95 to -100

-0.1

-0.6 to -0.8

-0.6

Indonesia

n.d.

n.d.

n.d.

n.d.

n.d.

n.d.

South Africab

64

-50

-100

0

-2.1

-1.8

United States

46

-65

-100

-1.5

-2.0

-1.3

World

30c

n.d.

-95

n.d.

n.d.

-0.9c

Notes: Targets are framed as percentage reduction from 2015 levels. Percentage reduction needed values are rounded to closest 5 percent; ranges are derived from CAT scenarios representing different options for emissions reductions. No global target is established for 2030. The absolute values shown here carry high uncertainty and should be viewed with caution.

n.d. indicates no data available from Climate Action Tracker.

a Targets are defined as percentage reduction from 2015 levels. While 2017 historical data are available for most countries assessed, 2015 is chosen as the base year for establishing targets in CAT (2020a).

b 2005–15 percentage change is calculated for South Africa due to data availability.

c Only 2017 historical data are available for World and are used in percentage change needed calculation.

Source: CAT (2020a).

Table 5 | Commercial buildings carbon intensity in 2015 and target reductions for 2030 and 2050 (kg CO2/m²)

Country

2015a (kgCO2/m2)

2030 Target

(% Change from 2015 Levels)

2050 Target

(% Change from 2015 Levels)

Historical Average Annual Change, 2012–17 (kgCO2/m2)

Average Annual Change Target, 2015–30 (kgCO2/m2)

Average Annual Change Target, 2015–50 (kgCO2/m2)

Brazil

63

-75

-100

1.4

-3.2

-1.8

China

49

-65

-100

-1.1

-2.1

-1.4

European Union (28)

60

-75

-100

-2.4

-3.0

-1.7

India

38

-70

-100

-0.8

-1.8

-1.1

Indonesia

n.d.

n.d.

n.d.

n.d.

n.d.

n.d.

South Africa

130

-70

-100

-1.1b

-6.1

-3.7

United States

113

-75

-100

-3.3

-5.7

-3.2

World

61c

n.d.

-100

n.d.

n.d.

-1.8c

Notes: Targets are framed as percentage reduction from 2015 levels. Percentage reduction needed values are rounded to closest 5 percent; ranges are derived from CAT scenarios representing different options for emissions reductions. No global target is established for 2030. The absolute values shown here carry high uncertainty and should be viewed with caution.

n.d. indicates no data available from Climate Action Tracker.

a Targets are defined as % reduction from 2015 levels. While 2017 historical data are available for most countries assessed, 2015 is chosen as the base year for establishing targets in CAT (2020).

b 2010–15 percentage change is calculated for South Africa due to data availability.

c Only 2017 historical data are available for World and are used in percentage change needed calculation. No global target is established for 2030.

Source: CAT (2020a).

Figure 27 | Historical trends and required declines in the energy intensity of residential buildings


Source: CAT (2020b).

The targets are established such that, with efficiency gains in all energy end uses in buildings—including space heating and cooling, water heating, lighting, cooking, and appliances—energy use per square meter will be cut almost by half in most regions in 2050 compared to 2015 levels. A global target for energy intensity has not been established given the wide variety in local climate conditions, which significantly affect energy demand. Tables 6 and 7 spell out how far we have to go.

Figure 28 | Historic trends and required declines in the energy intensity of commercial buildings

Source: CAT (2020b).

Table 6 | Residential buildings energy intensity in 2015 and target reductions for 2030 and 2050 (kWh/m²)

Country

2015a (kWh/m2)

2030 Target

(% Change), 2015–30

2050 Target

(% Change), 2015–30

Historical Average Annual Change, 2012–17b (kWh/m2)

Average Annual Change Target, 2015–30 (kWh/m2)

Average Annual Change Target, 2015–50 (kWh/m2)

Brazil

66

-20

-20

-0.1

-0.9

-0.4

China

79

-20

-50

0.7

-1.1

-1.1

European Union (28)

161

-30

-60

-4.1

-3.2

-2.8

India

126

-20 to -25

-45

-7.2

-1.7 to -2.1

-1.6

Indonesia

n.d.

n.d.

n.d.

n.d.

n.d.

n.d.

South Africa

135

-25

-45

0.0

-2.3

-1.7

United States

138

-25 to -30

-60

-1.2

-2.3 to -2.8

-2.4

Worldc

n.d.

-33d

n.d.

-0.8%d

n.d.

n.d.

Notes: n.d. indicates no data. No data are available for Indonesia.

a Targets are defined as percentage reduction from 2015 levels. While 2017 historical data are available for most countries assessed, 2015 is shown here as the base year for establishing targets in CAT (2020a).

b 2005–15 percentage change is calculated for South Africa due to data availability.

c No target is established for World for buildings energy intensity.

d As no value and target are available from CAT (2020a), the sustainable development scenario target is included here as a reference. The World annualized percentage change is based on index (2000 = 100) data during 2014–19 available from IEA (2020h). The rate does not differentiate between residential and commercial buildings and is used as a reference here.

Source: CAT (2020a).

Table 7 | Commercial buildings energy intensity in 2015 and target reductions for 2030 and 2050 (kWh/m²)

Country

2015a (kWh/m2)

2030 Target Range

(% Change, 2015–30)

2050 Target Range

(% Change, 2015–50)

Historical Average Annual Change, 2012–17b

(kWh/m2)

Average Annual Change Target, 2015–30 (kWh/m2)

Average Annual Change Target, 2015–50 (kWh/m2)

Brazil

353

-10% to -15%

-15% to -30%

2.2

-2.4 to -3.5

-1.5 to -3

China

115

-10% to -15%

-35% to -45%

-0.6

-0.8 to -1.2

-1.2 to -1.5

European Union (28)

209

-20% to -25%

-40% to -50%

-2.5

-2.8 to -3.5

-2.4 to -3

India

79

-10% to -15%

-25% to -35%

-0.7

-0.5 to -0.8

-0.6 to -0.8

Indonesia

n.d.

n.d.

n.d.

n.d.

n.d.

n.d.

South Africa

180

-25% to -30%

-45% to -50%

5.3

-3 to -3.6

-2.3 to -2.6

United States

305

-20% to -25%

-40% to -50%

-0.4e

-4.1 to -5.1

-3.5 to -4.4

Worldc

n.d.

-33%d

n.d.

-0.8%d

n.d.

n.d.

Notes: n.d. indicates no data.

a Targets are defined as percentage reduction from 2015 levels. While 2017 historical data are available for most countries assessed, 2015 is chosen as the base year for establishing targets in CAT (2020a).

b 2005–15 percentage change is calculated for South Africa due to data availability.

c No target is established for World for buildings energy intensity.

d As no value and target are available from CAT (2020a), the sustainable development scenario target is included here as a reference. The World annualized percentage change is based on index (2000 = 100) data during 2014–19 available from IEA (2020h). The rate does not differentiate between residential and commercial buildings and is used as a reference here.

e The U.S. historical rate of change appears moderate partly due to the low historical level in 2012, which is the beginning year of the five-year period used for calculation.

Percentage change needed values are rounded to closest 5 percent.

Source: CAT (2020a).

Indicator 3: Building renovation rate (%/yr)

2030: Global renovation rate increases to 2.5–3.5 percent per year

2040: Global renovation rate increases to 3.5 percent per year

Renovation rate is measured as the percentage of the entire building stock that is renovated each year. Renovating buildings is one of the primary ways to improve building envelopes and employ more efficient technologies as they become available. Renovation here refers to significant building upgrades that would reduce energy demand for heating and cooling. The renovation targets are thus an input to the emissions intensity and energy intensity targets.

Currently the world’s building stock is renovated at an average annual rate of around 1–2 percent, with energy intensity improvements at around 15 percent in general (IEA 2020a), with much variation by region. Developed countries are assumed to have built most of their building stock already, so it is crucial to improve performance of existing building stock to net-zero or near-net-zero emissions and at an accelerated rate. Developing countries, in contrast, are still rapidly constructing new buildings and could seize the opportunity by holding new buildings to net-zero or near-net-zero emissions standards. Developed regions and countries like the European Union and the United States are expected to reach a renovation rate of 3.5 percent by 2030, while developing and emerging economies including Brazil, China, India, and South Africa are expected to increase their renovation rate to 2.5 percent in 2030, and 3.5 percent in 2040 (Table 8). Note that no target rates are established for 2050 because, if targets for 2030 and 2040 are achieved, renovation should be completed by 2050.

Table 8 | Historical and target renovation rates for residential and commercial buildings


Renovation Rate (per Year)

Country/Region

Historical (Estimated World Average, %)

2030 Target (%)

2040 Target (%)

Brazil

1 to 2a

2.5

3.5

China

2.5

3.5

European Union (28)

3.5

3.5

India

2.5

3.5

South Africa

2.5

3.5

United States

3.5

3.5

World

2.5 to 3.5

3.5

Notes: 
a The IEA estimates that the typical energy renovation rate is 1–2 percent for building stock per year, with less than 15 percent energy intensity reduction in general, while deep renovation of 30–50 percent energy intensity reduction is what’s needed for a sustainable development scenario. No country-level historical data are available for this indicator. Target values are rounded to the nearest 0.5 percent.

Source: CAT (2020a). Historical estimate: IEA (2020a).


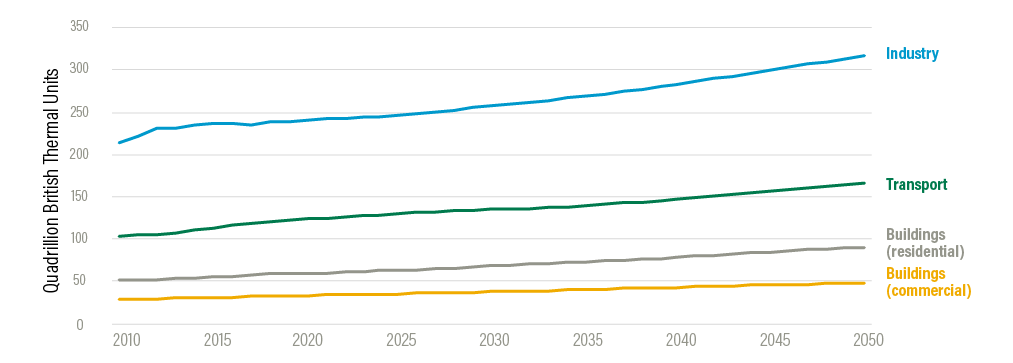
The industry sector accounts for more than half of end-use energy consumption globally, followed by transport and buildings (EIA 2019). It is also projected to see the most growth between 2018 and 2050 compared with the other two sectors (Figure 29).

Heavy industries such as iron and steel, cement, and chemicals production contribute more than 65 percent of direct CO2emissions from the industry sector (IEA 2020e). Heavy industry remains hard to decarbonize—due to factors including the need for very high heat, emissions inherent in some of the chemical conversion processes, and long facility lifetimes with high capital expenditure needed for upgrades—although this is not unachievable (Energy Transitions Commission 2018).

Figure 29 | World end-use energy consumption by sector, 2010–50

Source: EIA (2019).

Switching to less carbon-intensive processes for energy-intensive industries can improve material efficiency and energy efficiency, bringing economic benefits in addition to the environmental and social benefits brought through reduced emissions.

Less energy-intensive manufacturing and nonmanufacturing subsectors, which account for around half of energy consumption by the industrial sector, are not set with individual carbon intensity targets here. Service industries are not discussed here.

Indicator 1: Carbon intensity of cement production (kgCO2/t)

2030: 40 percent lower than 2015 levels

2050: 85–91 percent lower than 2015 levels, aspirational target to reach 100 percent reduction

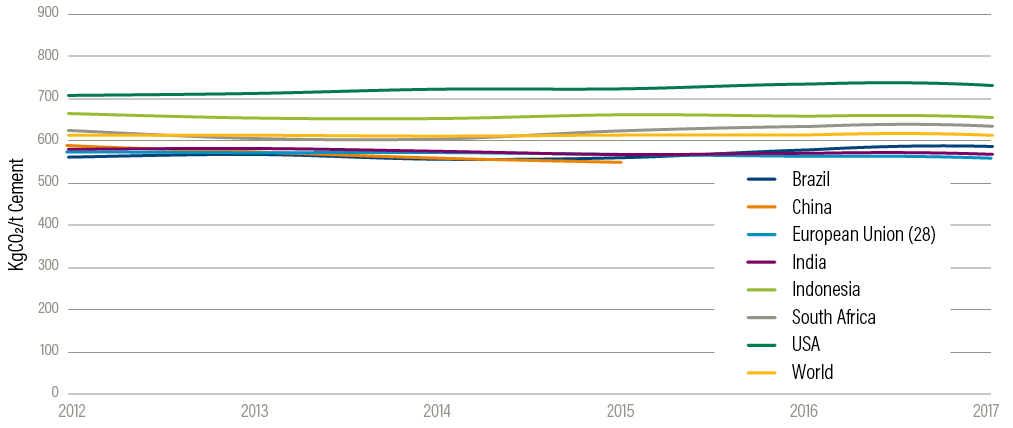
The carbon intensity of cement production is measured as kilograms of carbon dioxide emitted per tonne of cement produced (kgCO2/t). Global demand for cement is likely to continue growing through 2050, especially in developing countries, where most urbanization and infrastructure expansion is expected in the coming decades. Emissions intensity has been relatively stable over the past few years (Figure 30), but drastic reductions are required to decarbonize the cement production process.

Cement emissions are considered hard to abate because more than half are process emissions that are inherent in the chemical conversion of raw materials to clinker, the main ingredient in cement. The remaining emissions come from the energy needed to power that calcining process. The primary options to reduce process emissions in cement production are carbon capture and storage (CCS), clinker substitution, or fundamentally altering the chemistry of cement, which is not yet widely practiced (IEA and CSI 2018). Clinker substitution can only go so far. Therefore, while the potential of CCS is uncertain, it presents one of the more promising emissions reduction strategies for conventional Portland cement.

Figure 30 | Carbon intensity of cement production, 2012–17

Sources: CAT (2020a). China: Wei and Cen (2019); other countries: WBCSD (2016).

Ranges in the target for each country mainly reflect various levels of application. In the longer term, there are many different types of novel cement in development; some in production use fundamentally different chemistries that reduce both process and thermal emissions. Accelerating the deployment of these would likely be critical to meeting the targets. Other approaches can be used to reduce energy-related emissions, including improving energy efficiency and switching to alternative fuels like hydrogen.

Additional efforts on the demand side, like increasing the recycling of concrete, reducing overuse in construction, incentivizing longer-lived buildings, or replacing concrete with materials like mass timber, may not reduce emissions intensity but would reduce the overall production and total emissions.

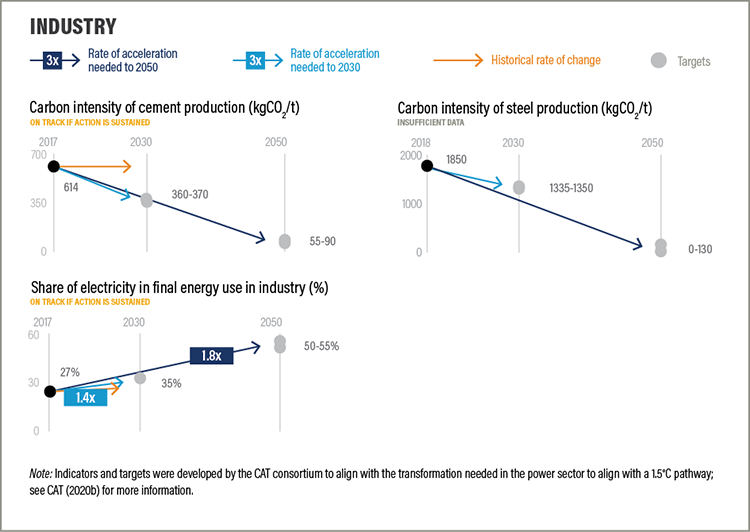
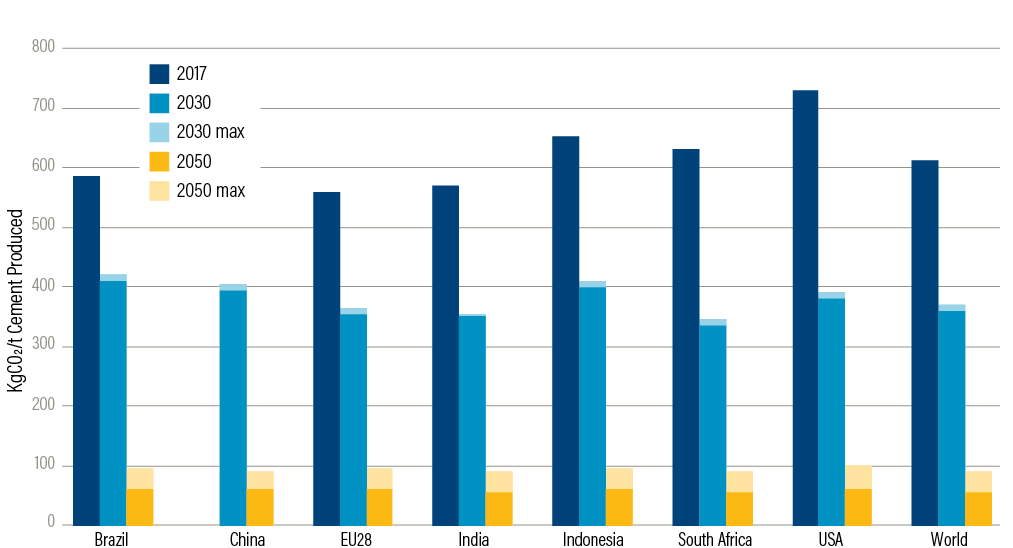
If we are to get on a pathway compatible with the Paris Agreement, the carbon intensity of cement production needs to be significantly reduced to 360–80 kgCO2/t of cement produced in 2030, and 55–90 kg/CO2/t of product in 2050, compared to current levels of around 615 kgCO2/t of cement produced (Figure 31). Table 9 shows in detail how far we have to go.

Figure 31 | Carbon intensity of cement production in 2017 and targets for 2030 and 2050

Source: CAT (2020a).

Table 9 | Carbon intensity of cement production in 2017 and targets for 2030 and 2050 (kgCO2/t)

Country

2017

2030 Target Range (% CHANGE FROM 2015 LEVELS)

2050 Target Range (% CHANGE FROM 2015 LEVELS)

Historical Average Annual Change, 2012–17b

Average Annual Change Target, 2017–30

Average Annual Change Target, 2017–50

Brazil

585

410 to 420 (-28% to -30%)

60 to 95 (-84% to -90%)

5

-12.7 to -13.4

-14.8 to -15.9

Chinaa

550

395 to 405 (-26% to -28%)

60 to 90 (-84% to -89%)

-13

-11.1 to -11.9

-13.9 to -14.8

European Union (28)

559

355 to 365 (-35% to -36%)

60 to 95 (-83% to -89%)

-3

-14.9 to -15.7

-14.1 to -15.1

India

569

350 to 355 (-38% to -38%)

60 to 100 (-84% to -90%)

-2

-16.5 to -16.8

-14.2 to -15.4

Indonesia

654

400 to 410 (-37% to -39%)

60 to 95 (-85% to -91%)

-2

-18.8 to -19.5

-16.9 to -18

South Africa

633

335 to 345 (-45% to -47%)

55 to 90 (-86% to -91%)

2

-22.2 to -22.9

-16.5 to -17.5

United States

731

380 to 390 (-47% to -48%)

55 to 90 (-86% to-92%)

5

-26.2 to -27

-19.4 to -20.5

World

614

360 to 370 (-40% to -41%)

55 to 90 (-85% to -91%)

0

-18.8 to -19.5

-15.9 to -17

Notes:

a The latest available historical data for China are from 2015.

b Historical trend data are available only for 2012–17.

Source: CAT (2020a).

Indicator 2: Carbon intensity of steel production (kgCO2/t)

2030: 25–30 percent lower than 2015 levels

2050: 95–100 percent lower than 2015 levels

The carbon intensity of steel production is measured as kilograms of carbon dioxide emitted per tonne of steel produced (kgCO2/t). Iron and steel production is the second-largest emitter (25 percent) in the industrial sector (IEA 2020e), contributing around 8 percent of global CO2emissions (Hoffmann et al. 2020). A wide range of technologies could be considered to decarbonize the steel subsector, and the only way to deliver net-zero emissions will be through a combination of approaches. An aspirational target of 100 percent emissions carbon intensity reduction by 2050 is set for all countries, which could be achieved with innovative technologies and developments currently being researched.

In recent years, the carbon intensity of steel production has been improving slightly in key countries except Brazil (Figure 32). Most progress has been achieved through energy efficiency improvements, but opportunities for further improvements in that area are limited. On the supply side, innovative technology, adoption of low-carbon fuel, and CCS are needed, while improvement of material efficiency as well as substitution of other materials like mass timber for steel, where possible, could help reduce demand.

Steel can be produced in two main ways: through a blast furnace (BF)/basic oxygen furnace (BOF) or an electric arc furnace (EAF). The BF/BOF uses iron ore as an input and depends on the use of coal to produce steel from the iron ore, while the EAF uses primarily recycled steel and direct reduced iron (though the BF/BOF process can use up to 30 percent recycled steel). Globally, around 70 percent of steel is produced using BF/BOF and the remaining 30 percent with EAF (World Steel Association 2019).

Figure 32 | Carbon intensity of steel production, 2005–19


Note: South Africa, Indonesia, and World only have single-year data points available.

Source: CAT (2020a).

Increasing the share of scrap-based EAFs can help reduce emissions, but EAF-produced steel may not be of sufficient quality for some end uses, where BF/BOF is generally used. Increasing the share of EAF also depends on a decarbonized grid to supply low-carbon electricity and the availability of high-quality scrap steel.

In addition to increasing the use of recycled scrap steel, two technology routes for BF/BOF are considered when setting targets for the steel sector; the ranges in the targets represent the impacts of following these different routes. One route assumes the phaseout of BF/BOF by 2050 and smelt reduction technology built with CCS by 2050; the other route assumes that the BF/BOF steel production route does not phase out till 2070, and CCS technology is applied to those BF/BOF plants (CAT 2020a).

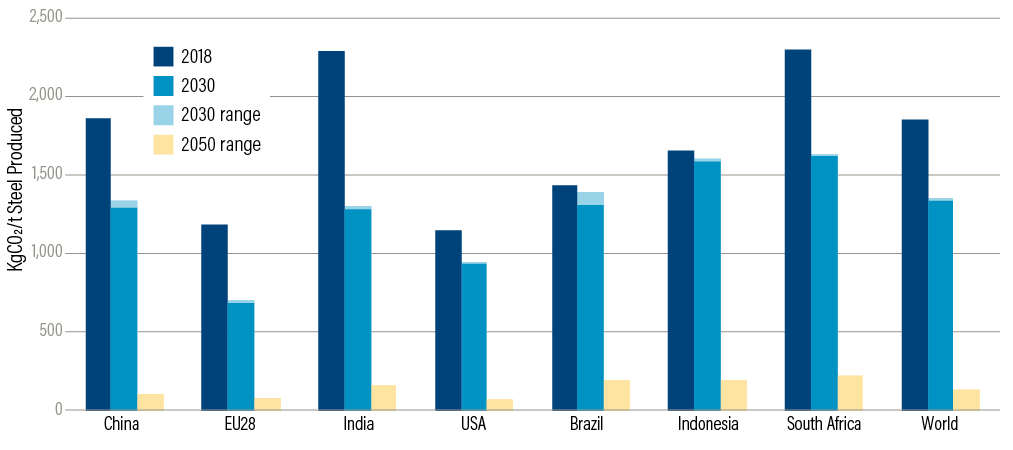
Figure 33 | Carbon intensity of steel production in 2018 and targets for 2030 and 2050

Notes: Shaded areas indicate ranges.

For Indonesia and South Africa, the most recent available historical data are from 2016.

Source: CAT (2020a).

For a pathway compatible with the Paris Agreement, the carbon intensity of global steel production needs to reach 1,335–50 kg CO2per tonne of steel produced in 2030, and 0–130 kg CO2per tonne of steel produced in 2050 (Figure 33). National targets are established for Chinese and U.S. steel production to reach nearly 100 percent decarbonization in 2050, while targets for countries with lower scrap availability, such as South Africa and Indonesia, are less stringent since this is the highest prioritized decarbonization technology considered in the modeling. Table 10 spells out how far we have to go.

Table 10 | Carbon intensity of steel production in 2018 and targets for 2030 and 2050 (kg CO2/t)

Country

2018

2030 Target Range c (% CHANGE FROM 2015 LEVELS)

2050 Target Rangec (% CHANGE FROM 2015 LEVELS)

Historical Average Annual Change, 2013–18

Average Annual Change Target, 2018–30

Average Annual Change Target, 2018–50b

Brazil

1,436

1,305 to 1,390 (-3% to -9%)

0 to 195 (-86% to -100%)

12

-3.8 to -10.9

-38.8 to -44.9

China

1,856

1,290 to 1,335 (-28% to -30%)

0 to 100 (-95% to -100%)

-37

-43.4 to -47.2

-54.9 to -58

European Union (28)

1,178

680 to 700 (-41% to -42%)

0 to 75 (-94% to -100%)

-29

-39.8 to -41.5

-34.5 to -36.8

India

2,285

1,280 to 1,295 (-43% to -44%)

0 to 155 (-93% to -100%)

-25

-82.5 to -83.8

-66.6 to -71.4

Indonesia

1,656a

1,585 to 1,600 (-3% to -4%)

0 to 190 (-89% to -100%)

n.d.

-4.7 to -5.9

-45.8 to -51.8

South Africa

2,295a

1,620 to 1,630 (-29% to -29%)

0 to 215 (-91% to -100%)

n.d.

-55.4 to -56.3

-65 to -71.7

United States

1,142

930 to 945 (-17% to -19%)

0 to 70 (-94% to -100%)

-27

-16.4 to -17.7

-33.5 to -35.7

World

1,850

1,335 to 1,350 (-27% to -28%)

0 to 130 (-93% to -100%)

n.d.

-41.6 to -42.9

-53.8 to -57.8

Notes: n.d. indicates no data.

a For Indonesia and South Africa, the most recent available historical data are from 2016; no complete time-series data are available to calculate historical average annual change.

b An aspirational target of 100 percent emissions intensity reduction by 2050 is set for all countries. This may be achieved with innovative technologies and developments currently being researched.

c Targets for steel are expressed to the nearest 5 percent to reflect the accuracy and leeway in the underlying analysis.

Source: CAT (2020a).

Indicator 3: Share of electricity in final energy use in industry (%)

2030: Increase to 35 percent from 27 percent in 2017 globally

2050: Increase to 50–55 percent globally

The electrification of industry is measured as the percentage of final energy demand in industry that is met by electricity and considers all industry, not just cement and steel. Fossil fuels still provide the majority of energy for the industrial sector globally, but electricity provides one option for decarbonization if the grid uses low-carbon generation sources. Of the total energy consumed by the industrial sector, 35 percent takes the form of fuels used for feedstock, 44 percent is fuel consumed for energy, and 20 percent is consumed as electricity, which is used mostly to drive machines such as pumps, robotic arms, and conveyor belts (Roelofsen et al. 2020).

Fossil fuels are used to provide the high-temperature heat that is essential in many industrial processes; for example, production of metal, chemicals, and cement, where heat demand ranges from 400°C to more than 1,400°C. The higher temperatures are not easily provided by electricity using commercially available technologies. Alternative fuels like green hydrogen (produced through electrolysis of water powered by renewable energy) could play a role in the longer term, with the largest potential reductions when paired with EAF technology (Hoffmann et al. 2020). Emerging research is also focused on the potential of using solar concentrating mirrors to achieve high heat.

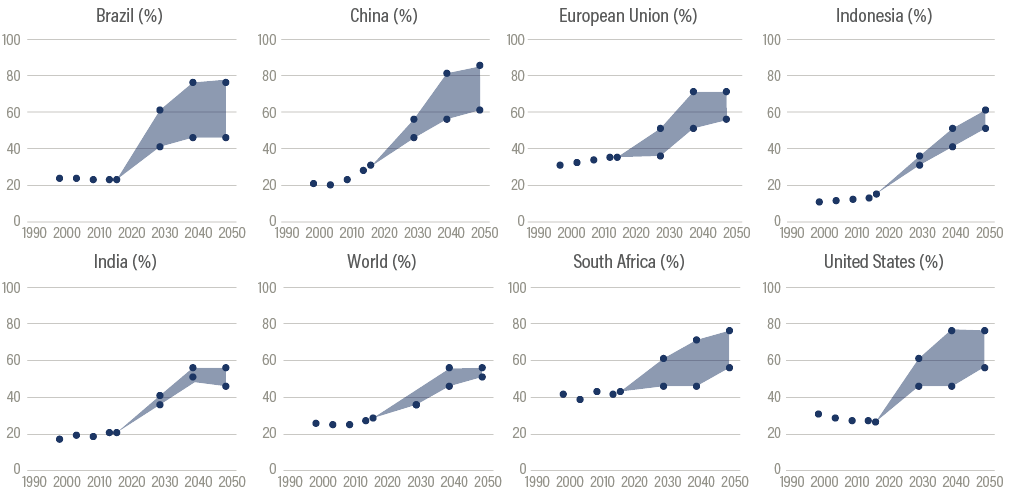
A range of electrification pathways compatible with achieving the goals of the Paris Agreement are presented in Figure 34, recognizing that 100 percent electrification cannot be achieved anywhere and that the cement sector is inherently difficult to electrify (CAT 2020b). The electrification rate targets vary among countries, according to different national circumstances. China, the European Union, and the United States have high availability of scrap metal for steel production. Given the high use of electricity in the steel recycling process, their upper bound targets are higher. Table 11 spells out how far we have to go.

Figure 34 | Share of electricity in industrial energy use and targets (%)

Source: CAT (2020a).

Table 11 | Share of electricity in industry sector final energy demand in 2017 and targets for 2030 and 2050 (%)

Country

2017

2030 Target Range

2050 Target Range

Historical Average Annual Change, 2010–17

Average Annual Change Target, 2017–30

Average Annual Change Target, 2017–50

Brazil

22

30 to 35

50 to 60

-0.03

0.6 to 1.0

0.9 to 1.2

China

30

45 to 55

60 to 85

1.16

1.2 to 1.9

0.9 to 1.7

European Union (28)

34

40 to 60

45 to 75

0.18

0.5 to 2.0

0.3 to 1.2

India

20

35 to 40

45 to 55

0.32

1.2 to 1.5

0.8 to 1.1

Indonesia

14

20 to 35

25 to 50

0.40

0.5 to 1.6

0.3 to 1.1

South Africa

42

45 to 60

55 to 75

-0.05

0.2 to 1.4

0.4 to 1.0

United States

26

35 to 50

55 to 70

-0.10

0.7 to 1.9

0.9 to 1.3

World

27

35

50 to 55

0.44

0.6

0.7 to 0.8

Global acceleration

needed


1.4x to 2030

1.8x to 2050

Note: Acceleration factors are averaged where the targets include a range.

Source: CAT (2020a).

Decarbonizing the industry sector through electrification can only be achieved with concurrent decarbonization of the power grid. Electric equipment for industrial heating in general brings only slight efficiency benefits compared to fossil fuel–based options. Thus, achieving the power sector targets is a prerequisite for achieving carbon emissions reductions by electrifying industrial processes.


The transport sector is the second-fastest-growing source of GHG emissions after industry. Globally it accounts for almost one-quarter of the world’s total CO2emissions from the burning of fossil fuels (IEA 2018). Emissions from the sector are expected to continue growing at a faster rate than most other sectors, posing a major challenge to reducing emissions and meeting the temperature goals of the Paris Agreement.

Transitioning to a more sustainable and decarbonized transport sector will require a combination of measures, including managing travel demand and encouraging behavior change to more efficient travel modes such as public transit, fuel switching to electricity and other low-carbon fuels, more stringent vehicle emissions and efficiency standards, better city planning, and more. In addition to emissions reductions and improved air quality, a more sustainable transport sector can also mean better road safety, reduced congestion, and more livable urban conditions overall. While we acknowledge the importance of these measures to a full decarbonization of the sector, for the following indicators we will be following CAT (2020b) which focuses solely on electric vehicles and low-emissions fuels. It should be noted that those are possible options but shall not be treated as the only potential decarbonization pathways of the transportation sector. 

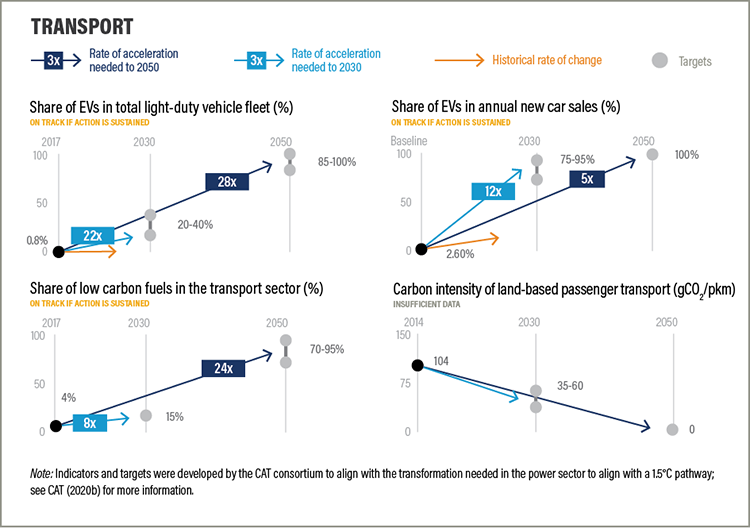
Indicator 1: Share of EVs in total light-duty vehicle fleet (%)

2030: 20–40 percent globally

2050: 85–100 percent globally

Deployment of EVs is one of the most important measures to reduce emissions from the transport sector. Both Indicators 1 and 2 in this section look at the uptake of electric vehicles in passenger cars. The indicators are limited in that EV adoption provides only a partial solution to decarbonizing the transport sector. The indicators and targets set here provide a possible pathway toward a future compatible with the Paris temperature goal, based on available technology. However, achieving this goal will take behavior change: reducing traffic demand, promoting public transit and low-carbon modes of travel, improving technologies and fuels, and equitably allocating public investment both to meet the growing travel demand and to address the impacts of climate change. We also acknowledge that scaling up EVs comes with challenges related to extraction of raw materials and that environmental and social harm from these activities should be minimized.

The indicator covers light-duty vehicles (passenger cars) only; share is defined as the percentage of electric light-duty vehicles (LDVs) in the overall LDV fleet. It refers only to battery electric vehicles (BEVs) and excludes plug-in hybrid electric vehicles (PHEVs). It is important to note that the uptake of EVs needs to be accompanied by the decarbonization of the power grid to achieve emissions reductions.

Figure 35 | Global battery electric vehicle stock (thousand vehicles)

Note: This covers only battery electric vehicles.

Source: IEA (2020d).

Globally, EVs have rapidly penetrated the light-duty vehicle fleet in the past decade. In 2019, over 2 million EVs were sold, compared to 450,000 in 2015 (BNEF 2020a). Currently over 7 million electric cars22 (including 4.8 million BEVs) are on the road, representing 1 percent of the global car stock in 2019, and appearing to be growing at an accelerating pace (Figure 35). Norway is currently leading in terms of share of EVs in the total car stock with 13 percent in 2019, followed by 4.4 percent in Iceland (IEA 2020d).

Countries, states, provinces, and cities have been introducing policies such as zero-emissions vehicle (ZEV) sales targets and tax credits for ZEV purchases. The IEA’s Electric Vehicles Initiative (EVI) set the goal of EVs reaching 30 percent market share by 2030 through its EV30@30 campaign in 2017 (IEA 2017). In the private sector, the Climate Group’s EV100 initiative brings together 67 member companies representing 80 markets in the world, committing to accelerating the transition to EVs (Climate Group 2020).

The share of EVs in the current stock is well below 1 percent in most countries, and it would require an enormous and rapid transition for this share to reach the level necessary to align with the Paris Agreement climate goals (CAT 2020a). The share of light-duty EVs needs to reach at least 10 percent in the world’s major economies by 2030, 45–95 percent by 2040, and 70–100 percent in 2050 (Figure 36). In the cases of China, India, and Indonesia, two- and three-wheelers are included in the scope for Indicators 1, 2, and 3 in the transport sector. While unusual, this approach was taken because two- and three-wheelers make up a significant share of LDVs in those countries. Table 12 spells out how far we have to go.

Figure 36 | Share of light-duty electric vehicles in light-duty vehicle fleet of major economies (%)

Note: For India, Indonesia, and China, the LDV fleet includes two- and three-wheelers, which represent a significant share of LDVs. Shaded areas represent ranges.

Source: CAT (2020a).

Table 12 | Share of light-duty electric vehicles in total light-duty vehicle fleet (%)

Country

2017

2030 Target Range

2050 Target Range

Historical Average Annual ChangeC

Average Annual Change Target, 2017–30

Average Annual Change Target, 2017–50

Brazil

0.0b

20 to 40

75 to 100

n.d.

1.5 to 3.1

2.3 to 3.0

Chinaa

0.17

35 to 50

80 to 100

n.d.

2.7 to 3.8

2.4 to 3.0

European Union (28)

0.29

40 to 55

95 to 100

n.d.

3.1 to 4.2

2.9 to 3.0

Indiaa

0.06

15 to 55

85 to 100

n.d.

1.2 to 4.2

2.6 to 3.0

Indonesiaa

0.0b

10 to 45

70 to 100

n.d.

0.8 to 3.5

2.1 to 3.0

South Africa

0.02

30 to 50

85 to 100

n.d.

2.3 to 3.8

2.6 to 3.0

United States

0.31

30 to 40

85 to 100

n.d.

2.3 to 3.1

2.6 to 3.0

World

0.8d

20 to 40

85 to 100

0.1d

1.5 to 3.0

2.6 to 3.0

Global acceleration needed


22x to 2030

28x to 2050

Notes: n.d. indicates no data.

a Two- and three-wheelers included.

b 2010 data shown for Brazil; 2015 data shown for Indonesia.

c Historical rate of change is not calculated here since the base level is 0.

d 2019 numbers based on IEA (2020d) as a proxy for historical level globally. Historical average annual change is calculated for 2014–19. Both BEVs and PHEVs are covered here.

Acceleration factors are averaged where the targets include a range.

Source: CAT (2020a).

Indicator 2: Share of EVs in annual new car sales (%)

2030: 75–95 percent globally

2050: 100 percent globally

This indicator covers light-duty vehicles (passenger cars) only; share is defined as the market share (percentage) of electric light-duty vehicles (LDVs) in total light-duty vehicle sales. EV here refers only to battery electric vehicles (BEVs) and excludes plug-in hybrid electric vehicles (PHEVs). The indicator does not discuss the utilization rate of EVs once purchased. The estimated effect of EVs in reducing emissions from the transport sector is discussed in Indicator 3 below.

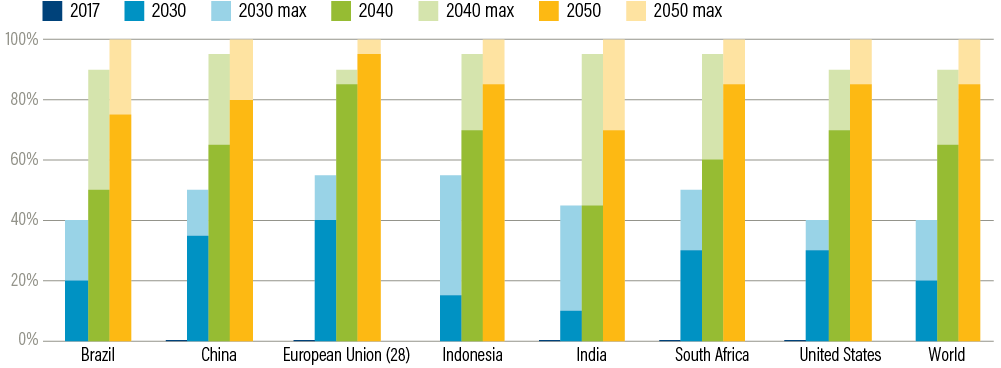
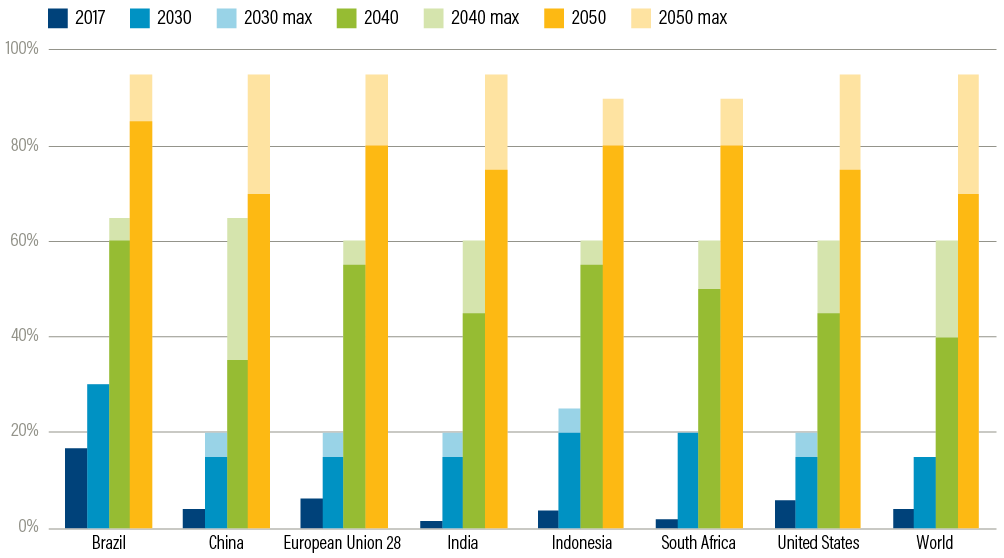
To decarbonize transportation, all new passenger vehicles will need to be zero-carbon vehicles. In 2017, the share of EVs in new car sales was still quite small, around 1 percent in the United States and European Union, and much lower in other countries (CAT 2020a). In 2019, 2.6 percent of the cars sold worldwide were electric,23 and Norway has the highest market share of EVs, at 56 percent. Twenty countries reached EV market shares above 1 percent (IEA 2020c). The targets aligned with a 1.5°C temperature pathway indicate that EVs should make up at least 45 percent of new cars sold in 2030, more than 85 percent in 2040, and nearly 100 percent globally in 2050 (Figure 37). Table 13 spells out how far we have to go.

Figure 37 | Target shares of electric vehicles in new car sales, 2030, 2040, and 2050 (%)

Notes: Shaded areas represent target ranges. In the case of China, India, and Indonesia, the percentage also includes two-wheelers and three-wheelers. Acceleration factors are averaged where the targets include a range.

Source: CAT (2020a).

Table 13 | Share of electric vehicles in new car sales in 2017 and targets for 2030 and 2050 (%)

Country

2017

2030 Target (Range)

2050 Target (Range)

Historical Average Annual Change

Average Annual Change Target, 2017–30 (Range)

Average Annual Change Target, 2017–50 (Range)

Brazil

0.02

45 to 95

95 to 100

n.d.

3.5 to 7.3

2.9 to 3.0

Chinaa

0.54

95 to 100

100

n.d.

7.3 to 7.7

3.0

European Union (28)

1.0

95 to 100

100

n.d.

7.2 to 7.6

3.0

Indiaa

0.06

80 to 95

100

n.d.

6.1 to 7.3

3.0

Indonesiaa

0.0b

95

100

n.d.

7.3

3.0

South Africa

0.1

50 to 95

100

n.d.

3.8 to 7.3

3.0

United States

1.1

95 to 100

100

n.d.

7.2 to 7.6

3.0

World

2.6c

75 to 95

100

0.6c

6.6 to 8.4

3.1

Global acceleration needed


12x to 2030

5.2x to 2050

Notes: n.d. indicates no data.

a Two- and three-wheelers included.

b 2015 data shown for Indonesia.

c 2019 numbers based on IEA (2020d) as a proxy for historical level and rate of change. Both battery electric vehicles (BEVs) and plug-in hybrid electric vehicles (PHEVs) are covered in the share. Historical rate of change is during 2017–19 based on available data.

Acceleration factors are averaged where the targets include a range.

Source: CAT (2020a).

The expansion of EVs poses a challenge in terms of the need for new infrastructure, such as charging stations, which is likely to constrain the EV market in the 2030s (BNEF 2020a). In 2019 there were 7 million LDV chargers, the vast majority (90 percent) of which were private. It is expected that private chargers will continue to account for a major share in 2030 (IEA 2020c).

As the cost of ownership of EVs has yet to reach a tipping point that makes them competitive with internal combustion engine (ICE) vehicles, the short-term uptake of EVs is still mostly driven by supportive policies. Policies in China, for example, include an EV credit system, fuel economy regulations, and city policies such as road space rationing that give road access priority to EVs (Li et al. 2020). China also leads in terms of electric buses, with 99 percent of the world’s e-bus fleet, driven by strong policy incentives such as national and local subsidies.

The successful deployment of electric vehicles so far has been heavily driven by policy incentives. Countries should adopt ambitious targets with longer-term visions to phase out ICE vehicles and achieve 100 percent EV stock by midcentury. Several countries, particularly in Europe, have announced targets of 100 percent EVs or complete phaseout of internal combustion engine vehicles between 2030 and 2050. Norway aims to achieve 100 percent zero-emissions vehicle sales by 2025 (IEA 2020c).

Indicators 1 and 2 mainly set targets for uptake of private electric vehicles. However, decarbonizing the transport sector needs to be achieved equitably. Investment in public transportation would be crucial in countries where trips are mostly made through nonmotorized transport, so that the increasing travel demand is met with public transportation instead of private car ownership.

Indicator 3: Carbon intensity of land-based passenger transport (gCO2/pkm)

2030: Around 50 percent reduction from 2014 levels

2050: Near-zero carbon emissions intensity

This indicator is measured as grams of carbon dioxide emitted per kilometer of passenger travel (gCO2/pkm) by cars, buses, and rail. A key opportunity to decarbonize passenger transport lies in incentivizing behavior change; for example, encouraging people to walk and cycle where possible, and use more public transportation and car-sharing rather than private vehicles.24 It is also important to shift from fossil-fuel combustion engine vehicles to electric or low-carbon-fuel vehicles.

The indicator covers the passenger transport modes of cars, buses, trains, and, in the case of China, Indonesia, and India, two- and three-wheeled vehicles. The targets aligned with a Paris-compatible pathway require emissions per passenger kilometer to be lower than 50 gCO2/pkm in most world regions by 2030, between 0 and 30 gCO2/km in 2040, and reach zero in 2050 (Figure 38). Table 14 spells out how far we have to go.

Reducing the emissions intensity of passenger transport could be accomplished by various measures; for example, by reducing the miles traveled by more carbon-intensive modes through behavior change and encouraging public transport, as well as reducing emissions intensities with more efficient engine technologies or a switch from ICE to electric vehicles. China has built the world’s largest fleet of electric buses, which could effectively reduce both the carbon intensity of passenger travel and emissions from the transport sector overall. In the European Union, the new regulation regarding the emissions performance standard for cars and vans is in effect. The standard sets a target to reduce carbon intensity (CO2/km) by 37.5 percent for cars and 31 percent for vans in 2030 relative to levels in 2021 (European Commission 2020b).

Indicator 4: Share of low-carbon fuels in the transport sector (%)

2030: 15 percent globally

2050: 70–95 percent globally

This indicator is defined as the share of low-carbon fuels in the final energy demand of the transport sector. Currently the transport sector is still largely dependent on fossil fuels and, in 2017, just 4 percent of global final energy demand for transportation was met with low-carbon fuels (Figure 39) (CAT 2020a). In 2017, transportation accounted for around two-thirds of global oil consumption (IEA 2019b), of which half was for road transport. Around one-quarter of CO2emissions from the transport sector are from nonroad modes such as shipping, aviation, and rail. Electrification is playing a major role in reducing emissions from rail transport. This is much less true for shipping and aviation.

Figure 39 | Share of zero-carbon fuels in transportation, 1990–2017 (%)


Source: CAT (2020a).

To be compatible with Paris Agreement temperature goals, zero-carbon fuels will need to supply 15–30 percent of total transport energy needs in 2030, increasing to 35–65 percent in 2040 and 70–95 percent in 2050 (Figure 40). Several zero-carbon fuel options can be considered, such as electricity, hydrogen, and biofuels. EVs offer the possibility of fully decarbonizing the passenger car fleet and buses when powered by a low-carbon grid, but shipping, air transport, and heavy freight transport remain hard to decarbonize. Table 15 spells out how far we have to go.

Figure 40 | Target shares of zero-carbon fuels in transportation for 2030, 2040, and 2050 (%)

Source: CAT (2020a).

Table 15 | Target shares of low-carbon fuels in the transport sector (% of final energy demand)

Country

2017

2030 Target Range

2050 Target Range

Historical Average Annual Change, 2010–17

Average Annual Change Target, 2017–30

Average Annual Change Target, 2017–50

Brazil

16.80

30

85 to 95

-0.01

1.0

2.1 to 2.4

China

4.11

15 to 20

70 to 95

0.07

0.8 to 1.2

2.0 to 2.8

European Union (28)

6.06

15 to 20

80 to 95

0.08

0.7 to 1.1

2.2 to 2.7

India

1.66

20 to 25

80 to 90

-0.03

1.4 to 1.8

2.2 to 2.7

Indonesia

3.61

15 to 20

75 to 95

0.43

0.9 to 1.3

2.2 to 2.8

South Africa

1.77

20

80 to 90

-0.03

1.4

2.4 to 2.7

United States

5.88

15 to 20

75 to 95

0.29

0.7 to 1.1

2.1 to 2.7

World

3.97

15

70 to 95

0.10

0.8

2.0 to 2.8

Global acceleration

needed


8.0x to 2030

24x to 2050

Note: Acceleration factors are averaged where the targets include a range.

Source: CAT (2020a).


Despite broad commitment across governments, civil society, and companies to reduce deforestation and increase reforestation, we continue to see persistently high levels of deforestation and insufficient levels of reforestation. In net terms, global forest area has been declining at a rate of around 0.1 percent to 0.2 percent per year for the past few decades, according to FAO (2020). However, these numbers hide some critical dynamics about what kinds of trees are being lost and gained, in what regions, and for what reasons. It is essential to look at tree cover gain and loss separately because gaining a softwood plantation in the United States, for example, is not the equivalent of losing primary tropical forest in Brazil in terms of biodiversity, carbon storage, and livelihood opportunities (Brown and Zarin 2013). Even natural regeneration takes decades to develop ecosystems comparable to mature forests that are lost. The world’s capacity to protect and restore millions of hectares of forests in the coming decades, in turn, depends on its ability to feed a growing world population while also peaking and then reducing the amount of land dedicated to agriculture (see Agriculture section below).

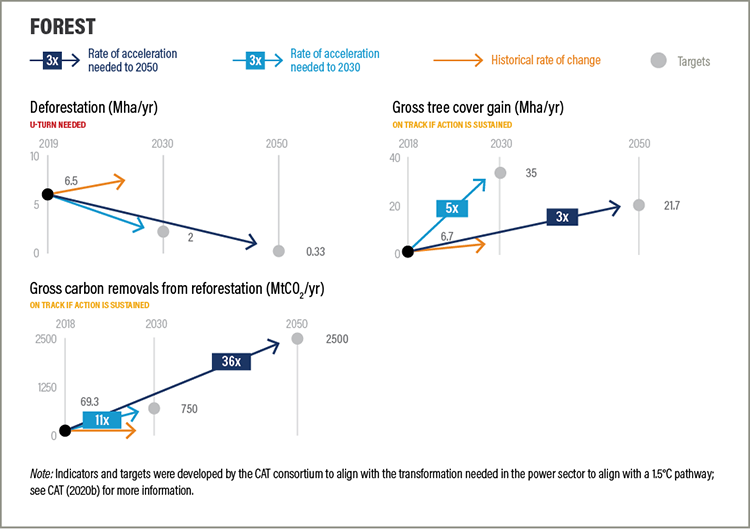
Indicator 1: Deforestation (million hectares)

2030: reduce by 70 percent from 2019 level25

2050: reduce by 95 percent from 2019 level

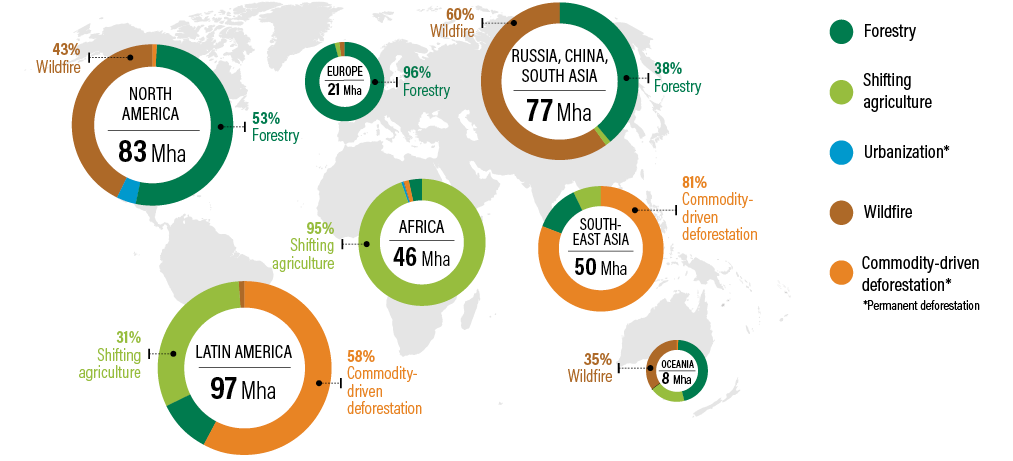
The area of tree cover lost each year has gradually increased since 2001 and has, on average, been driven roughly one-third by forestry (logging), one-quarter by commodity agriculture–driven land clearance, one-fifth each by fire and shifting agriculture, and the remaining 3 percent by urbanization (Figure 41). Fires and forestry are likely to be cyclical, causing temporary loss with near-term effects on carbon stocks, and are found largely in nontropical areas (GFW 2020). In contrast, commodity agriculture–driven deforestation, urbanization, and shifting agriculture are more likely to cause permanent loss (i.e., deforestation) from land use change, and are mostly found in the tropics. Given these dynamics, tropical forest loss should be the main focus of forest protection and restoration efforts.

Figure 41 | Regional distribution of dominant drivers of tree cover loss, 2001–18

Source: GFW (2020).

In 2014, a broad coalition of national governments and other organizations adopted the New York Declaration on Forests, with a goal of halving global deforestation by 2020 and eliminating it by 2030. Since then, tree cover loss has not declined but increased (NYDF Assessment Partners 2019).

A number of companies with supply chain exposure to major commodities including beef, soy, palm oil, and pulp and paper have made commitments to sustainable or zero-deforestation sourcing (Rothrock et al. 2019). However, only 8 percent have a zero-deforestation commitment that covers all their supply chains and operations (NYDF Assessment Partners 2019), and none of the world’s 350 largest companies will be able to achieve the target of eliminating deforestation from their production chains by 2020, to which 57 percent of them committed (Climate Chance 2019).

Figure 42 shows the trend in tree cover loss, deforestation, and tropical primary forest loss since 2001. Table 16 spells out how far we have to go.

The disappearance of tropical humid primary forest is a particularly important component of total tree cover loss. Primary forests are irreplaceable in terms of biodiversity and ecosystem services like carbon storage, and trees can be hundreds or even thousands of years old (Weisse and Goldman 2019). Tropical primary forest loss increased to an average of 4.3 Mha per year in 2014–18, after the adoption of the New York Declaration on Forests, from an average of 3 Mha per year in 2002–13, an increase of 44 percent (NYDF Assessment Partners 2019) (Figure 42).

Figure 42 | Tree cover loss, 2001–19, and targets for 2030 and 2050


Notes: Permanent deforestation includes tree cover loss from commodity-driven deforestation, urbanization, and shifting agriculture in primary tropical forests.

Data include only tropical humid primary forest; tropical dry primary forest is excluded, but its area is comparatively small.

Deforestation is a subset of tree cover loss, and tropical primary forest loss is a subset of deforestation.

Source: GFW (2020).

Carbon dioxide emissions from deforestation closely track the area of deforestation (Figure 43) and would be expected to decline as deforestation is reduced.

Table 16 | Permanent deforestation: Historical trends and targets for reduction by 2030 and 2050 (kha)

Country

2019 Deforestation

2030 Target (70% Reduction from 2019)

2050 Target

(95% Reduction from 2019)

Historical Average Annual Change, 2001–19

Average Annual Change Target, 2019–30

Average Annual Change Target, 2019–50

Bolivia

522

157

26

21.9

-33.2

-16.0

Brazil

2,012

604

101

5.1

-128.0

-61.7

China

9

3

0.5

0.3

-0.6

-0.3

Colombia

131

39

7

3.5

-8.3

-4.0

DRC

471

141

24

19.9

-30.0

-14.4

EU28

n.d.

n.d.

n.d.

n.d.

n.d.

n.d.

India

7

2

0.3

0.3

-0.5

-0.2

Indonesia

1,035

310

52

19.3

-65.9

-31.7

Malaysia

358

107

18

2.4

-22.8

-11.0

United States

114

34

6

-1.6

-7.3

-3.5

World

6,526

1,958

326

136.8

-415.3

-200.0

Global acceleration needed


U-turn needed

U-turn needed

Notes: Deforestation includes losses from commodity driven deforestation, urbanization, and shifting agriculture in primary forests.

Selected countries shown include major emitters (for consistency with other sectoral assessments) as well as additional countries where deforestation is high (e.g., Brazil, Democratic Republic of the Congo, Bolivia, Colombia, Malaysia); Global Forest Watch does not collect data on the European Union.

Historical rate of change looks at 2001–19 rather than the most recent five years in other sectors to better account for variation in deforestation year to year.

Sources: GFW (2020); Roe et al. (2019).

Figure 43 | Global annual gross emissions from tropical tree cover loss


Source: GFW (2020).

Indicator 2: Gross tree cover gain (cumulative Mha)

2030: gain of 350 Mha above 2014 level26

2050: gain of 678 Mha above 2017 level

Halting deforestation is critical, but it will not be enough to meet the Paris Agreement temperature goals—more trees also need to be added back to the landscape. The IPCC (2018) found that up to 950 Mha of land will need to be reforested by 2050 to hold temperature rise to 1.5°C; Griscom et al. (2017) found that 678 Mha of tree cover gain is feasible provided that grazing land is freed up through sustainable intensification of ruminant meat production and/or dietary shifts away from meat and toward more consumption of plant-based foods (see Agriculture section below).

In the near term, countries have coalesced around a target of restoring 350 Mha of degraded and deforested land by 2030, through the Bonn Challenge.27 We establish national targets here by dividing the total tree cover gain targets by the proportion of reforestation area potential identified in Griscom et al. (2017) (Table 17).

We note that the terms restoration and reforestation are not interchangeable: restoration covers a wide range of landscape improvements that can include tree-planting, agroforestry, and agriculture, while reforestation means replanting trees. Because there are no global data on reforestation, we include restoration targets to illustrate the scale of effort required.

While political will for reforestation and restoration is high, translating commitments to action has proved more difficult for a number of reasons, including competition for land for food production and limited capacity to collect data and report progress. Despite restoration pledges of 349 Mha under the Bonn Challenge and in countries’ nationally determined contributions (Cook-Patton forthcoming), only 26.7 Mha of land have actually been restored since 2000, according to available data, though data are not yet comprehensive (Bonn Challenge 2020; NYDF Assessment Partners 2019) (Figure 44).

Figure 44 | Targets for tree cover gain and restoration pledges compared to estimated actual land restored

Sources: NYDF Assessment Partners (2019); Bonn Challenge (2020); Roe et al. (2019); Cook-Patton et al. (Forthcoming).

Table 17| Estimated area of annual gross tree cover gain, 2000–12, national commitments to restoration, and targeted tree cover gain by 2030 and 2050 (Mha)

Countrya

Historical Average Annual Change, 2000–12b

Restoration Commitmentc

Average Annual Change Target, 2020–30

Average Annual Change Target, 2020–50

Bolivia

0.01

0.2

0.1

Brazil

0.63

22 by 2030

4.6

2.9

China

0.19

4.9

3.1

Colombia

0.05

1 by 2020

0.8

0.5

DRC

0.12

8 by 2030

0.5

0.3

EU28d

n.d.

n.d.

n.d.

India

0.02

21 by 2030

1.4

0.9

Indonesia

0.58

0.9

0.6

Malaysia

0.22

0.2

0.1

United States

1.15

15 by 2020

2.7

1.7

World

6.7

173

35.0

21.7

Global acceleration needed


5.2x by 2030

3.2x by 2050

Notes: n.d. indicates no data.

a Selected countries shown included major emitters (for consistency with other sectoral assessments) as well as additional countries where deforestation is high (e.g., Brazil, Democratic Republic of the Congo, Bolivia, Colombia, and Malaysia).

b Data are insufficient to track current levels of forest gain, so average annual tree cover gain 2000–2012 is used as a proxy and restoration commitments are included for context.

c Commitments are made under the Bonn Challenge and/or Initiative 20x20.

d GFW does not track data for the European Union as a whole.

Sources: GFW (2020); Bonn Challenge (2020); Initiative 20x20 (2020); Roe et al. (2019).

The ambitious scales of action outlined above will require, among other things, the mobilization of sufficient financing. Estimates point to the need for up to $49 billion to $67 billion annually in funding for large-scale restoration interventions (Löfqvist and Ghazoul 2019; NCE 2018). Most finance for restoration currently comes from public budgets since the benefits from restoration can be long-term and difficult to monetize, and projects may be perceived as risky (Ding et al. 2017). Activation of the private sector is thus a critical need in accelerating action. At the same time, studies indicate that restoring 350 Mha of forest land could create approximately $170 billion in net benefits per year over the next 50 years (Ding et al. 2017). This estimate includes both public benefits, like improved soil quality and biodiversity and reduced erosion, as well as private benefits like the sale of timber or other forest products.

Indicator 3: Gross carbon removal through tree cover gain (GtCO2)

2030: cumulative increase of 7.5 GtCO2over 2018 level

2050: cumulative increase of 75 GtCO2over 2018 level

The removal of carbon dioxide from the atmosphere (carbon sequestration) by trees through the process of photosynthesis will need to increase dramatically. IPCC data show that 100–1,000 GtCO2total needs to be removed from the atmosphere by the end of the century; at the moment, adding trees is the best approach most readily deployable on a large scale (NYDF Assessment Partners 2019; IPCC 2018).

Our targets are drawn from Roe et al. (2019), who conducted a bottom-up assessment of mitigation potential of land-based activities, considering only cost-effective (<$100/tCO2) mitigation that does not negatively impact food and fiber production or biodiversity (Roe et al. 2019; Griscom et al. 2017). Available data to estimate recent levels of carbon removal from tree cover increase date from 2012, but the levels they indicate are far below those required to reach these targets (Table 18).

A separate target for carbon removal from tree cover gain is established because increased carbon removal will not track exactly with tree cover gain—it will take years for carbon stocks to accumulate after trees are added. In contrast, emissions from deforestation track more closely time-wise to the deforestation. In addition, for trees to be permanent they need to fulfill other local ecosystem and economic functions and not be treated only as carbon sinks for the global community. Areas are thus important to understand the inputs needed and benefits gained besides carbon removal. As with all land-based carbon removal, however, uncertainty remains about permanence because reforested land may lose tree cover again.

Table 18 | Historical trends and targets for gross carbon dioxide removal from tree cover gain (MtCO2)

Country

Historical Average Annual Change (2000–12)

Average Annual Change Target (2020–30)

Average Annual Change Target (2020–50)

Australia

1.2

24

80

Bolivia

0.3

4

13

Brazil

10.9

98

325

China

1.9

105

348

Colombia

0.8

18

59

DRC

2.0

12

39

EU28

n.d.

n.d.

n.d.

India

0.4

29

97

Indonesia

10.0

20

65

Malaysia

3.7

4

14

United States

11.9

57

192

World

69.3

750

2,500

Global accel.needed


11x by 2030

36x by 2050

Notes: n.d. indicates no data.

Country shares of global target based on potential area for reforestation.

Baseline carbon removal is calculated from area gain in GFW (2020) and tCO2/ha removed from Griscom et al. (2017).

Global Forest Watch does not collect data for the European Union as a whole.

Sources: Emissions data estimated from GFW (2020) (for area) and Griscom et al. (2017) (for emission factors); targets adapted from Roe et al. (2019).


By 2050, there will be nearly 10 billion people on the planet (UNDESA 2019). Population and income growth are likely to lead to a roughly 50 percent increase in food demand between 2010 and 2050 under a business-as-usual scenario (Searchinger et al. 2019; FAO 2018). At the same time, the world needs to greatly reduce deforestation and increase forest restoration (see Forests section above) while also reducing GHG emissions from food production. Indeed, Sustainable Development Goal (SDG) 2 to end hunger and attain food security can only be truly achieved by simultaneously making progress toward SDGs around poverty reduction, human health, water, climate, forests, and oceans (FAO 2018). The World Resources Report: Creating a Sustainable Food Future (Searchinger et al. 2019) set a global goal of no more than 4 GtCO2e/yr of net emissions from the land sector (agricultural production plus land use change) by 2050 to keep global temperature rise below 2°C, and net-zero emissions from the land sector (made possible by large-scale reforestation offsetting ongoing agricultural production emissions of around 4 GtCO2e/yr) to stay within 1.5⁰C.

With increasing global demand for food, feed, and fiber, large-scale reductions in deforestation and increases in reforestation will only be possible if the world greatly improves the efficiency of land use. This will require increasing crop yields and output of meat and milk per hectare of pasture at higher than historical rates, while protecting soil health and freshwater resources. At the same time, it will be essential to slow the rate of growth in food and agricultural land demand by reducing food loss and waste, shifting diets away from high levels of meat (especially beef and lamb) consumption, and avoiding further expansion of biofuel production. Linking agricultural intensification with forest protection will be necessary to achieve the agriculture and forest targets simultaneously.

Drawing from modeling done by Searchinger et al. (2019), we propose five indicators to track progress in implementation of these solutions with targets for 2030 and 2050. We use publicly available data while updating the base year to 2017, and also show changes in these indicators since 2012. Targets were developed through a combination of global goal-setting and national- or regional-level model outputs but are subject to a range of uncertainties (Box 1).

Box 1 | Overview of the agriculture target-setting approach and caveats regarding data sources

The World Resources Report: Creating a Sustainable Food Future used a global accounting and biophysical model called GlobAgri-WRR to quantify the effects of different scenarios of food production and consumption patterns on agricultural land use demands and GHG emissions. With food security for 10 billion people, nearly 600 Mha of reforestation, and no more than 4 GtCO2e/yr of agricultural production emissions as the major global targets for the year 2050, Searchinger et al. (2019) analyzed the effects of various scenarios across all world regions. Only the most ambitious scenario, called “Breakthrough Technologies,” achieved the global environmental targets while feeding the world population in 2050. This scenario considered a shift toward current best practices as well as a range of technological improvements from farm to plate, including crop and animal breeding, feed additives to reduce livestock emissions, low-cost manure management technologies, various ways to reduce nitrogen losses from fertilizer use, compounds to prevent food spoilage, and plant-based meat substitutes.

The regional- and country-level 2050 targets for Indicators 1–3 and 5 in this section (dealing with GHG emissions, agricultural productivity, and dietary changes) are outputs of the GlobAgri-WRR model and take into account various factors, including projected population growth, previous and projected changes in incomes and consumption patterns, and technical potential for future productivity gains and GHG emissions reductions. Indicator 4’s targets are based on SDG Target 12.3 on food loss and waste reduction. Modeled reductions in agricultural land demand and GHG emissions for reaching targets in Indicators 2–5 are from Searchinger et al. (2019) but are not additive (e.g., if pasture intensification is achieved as in Indicator 3 but ruminant meat consumption also declines as in Indicator 5, the land and GHG effects of each “achievement” would be somewhat lower than shown).

Global-, regional-, and country-level 2030 targets were obtained by calculating the mean between 2010 (observed) indicators and the 2050 targets. Because the base year of this report is 2017, and progress across indicators between 2010–17 was uneven, there were several regional- or country-level examples where no additional “progress” was needed by 2030. In these cases, we set the 2030 target as “zero change from 2017.”

A major caveat regarding the baseline and target values in this section is the reliance on data from FAOSTAT. Although FAOSTAT data have several strengths, including coverage of most countries, relatively consistent methods across countries, and open access, they rely on national data submission, which can be subject to differences in definitions and quantification methods across countries and time. There can be discrepancies between methods used to generate FAOSTAT data and other measurement methods (e.g., using satellite data to map cropland and pastureland, or dietary surveys to estimate per capita food consumption patterns). As globally consistent data sets improve, it may become necessary in the future to reestimate baseline and target values for these indicators.

For more on the GlobAgri-WRR model, scenario assumptions, and global-level targets for these five indicators, see Box 2-1 and Table 32-1 in Searchinger et al. (2019).

Indicator 1: GHG emissions from agricultural production (MtCO2e)

2030: 22 percent reduction from 2017 level

2050: 39 percent reduction from 2017 level

This indicator measures annual emissions of greenhouse gases (expressed in terms of carbon dioxide equivalent) from agricultural production, including fossil fuel use, livestock and rice production, and use of synthetic fertilizers and manure. It excludes emissions from land use change caused by agriculture, which are largely covered in the Forests section above. Global agricultural production emissions grew by 3 percent between 2012 and 2017 (FAO 2020), and under a business-as-usual scenario, global agricultural production emissions are projected to grow by 27 percent between 2017 and 2050 (Searchinger et al. 2019). However, to keep global temperature rise below 1.5°C, emissions in 2050 would need to move in the other direction, falling by 39 percent relative to the year 2017 (Table 19) to near 4 GtCO2e (Searchinger et al. 2019).28

Emissions reductions would be required across all world regions relative to the year 2017, falling by between 20 and 60 percent (Table 19). In regions such as sub-Saharan Africa with high projected population and food demand growth, emissions targets are less stringent, whereas in areas of stable population and food demand growth, targets are more stringent (Table 1). Annual agricultural emissions data are available from FAOSTAT and would need to be adjusted as in Searchinger et al. (2019) and in Table 1 to match the 2030 and 2050 targets.29 Both supply-side (e.g., improvements in livestock feed and manure management, improvements in nitrogen use efficiency, improvements in rice management and breeds) and demand-side (e.g., reductions in food loss and waste and dietary shifts) actions could contribute to emissions reductions.

Unlike emissions from the power sector, emissions from agriculture are quite uncertain and variable and must be estimated indirectly. Most analyses and reporting of national agricultural emissions are based on simplified emissions factors recommended by the IPCC. Estimates can be done using very simple assumptions, such as constant emissions per cow, or they can be done in a somewhat more complicated fashion, such as varying emissions estimates based on cattle feeds. Although countries can develop and use their own national emissions factors, for consistency purposes, FAO uses simpler factors—which hides important limitations and uncertainties across countries. 

Table 19 | Agricultural production emissions: Historical trends and targets for 2030 and 2050 (MtCO2e)

Region

2017

2030 Target (% Change)

2050 Target (% Change)

Historical Average Annual Change, 2012–17

Average Annual Change Target, 2017–30

Average Annual Change Target, 2017–50

Asia (excluding China and India)

1,130

905 (-20%)

784 (-31%)

16.2

-17.3

-10.5

Brazil

434

346 (-20%)

270 (-38%)

3.0

-6.8

-5.0

U.S. and Canada

588

468 (-20%)

361 (-39%)

1.6

-9.2

-6.9

China

1,389

979 (-30%)

580 (-58%)

1.8

-31.5

-24.5

Former Soviet Union

307

241 (-22%)

201 (-35%)

5.2

-5.1

-3.2

India

974

802 (-18%)

655 (-33%)

3.8

-13.2

-9.7

Latin America (excluding Brazil)

455

361 (-21%)

281 (-38%)

2.2

-7.2

-5.3

Middle East and North Africa

295

245 (-17%)

211 (-28%)

1.4

-3.8

-2.5

Other OECD

294

198 (-33%)

155 (-47%)

-16.8

-7.4

-4.2

Sub-Saharan Africa

697

572 (-18%)

537 (-23%)

15.9

-9.6

-4.8

European Union

554

435 (-22%)

321 (-42%)

2.6

-9.2

-7.1

World

7,117

5,551 (-22%)

4,358 (-39%)

36.9

-120.5

-83.6

Global acceleration needed


U-turn in action needed

U-turn in action needed

Note: FAOSTAT emissions adjustments include a higher global warming potential value for methane (methane absorbs approximately 34 times more heat energy than carbon dioxide over a period of 100 years) based on the most recent IPCC recommendations, and a higher amount of agricultural energy use calculated by the GlobAgri-WRR model based on estimates from the U.S. Environmental Protection Agency and FAO.

Sources: FAO (2020) for 2012–17 change and with adjustments for year 2017; GlobAgri-WRR model in Searchinger et al. (2019) for 2030 and 2050 targets.

Indicator 2: Crop yields (t/ha/yr)

2030: 13 percent increase from 2017 level (7.4 t/ha)

2050: 38 percent increase from 2017 level (9.0 t/ha)

Even as crop yields30 are expected to continue to increase in coming decades (FAO 2018), models tend to project continued cropland expansion out to 2050 as the global population grows (Schmitz et al. 2014; Bajzelj et al. 2014; Searchinger et al. 2019), implying continued encroachment of cropland on forests. Therefore, yields must increase even faster than historical rates over the next 30 years in order to increase crop production on existing agricultural land and avoid additional expansion. Increasing productivity is the single most important step toward simultaneously meeting food production and environmental goals—and underpins the forest protection and restoration goals in the previous section—but it must be done in ways that protect soil health and water quantity and quality. Improving crop breeding, improving soil and water management, and planting existing cropland more frequently can all contribute to increased yields in a changing climate.

Table 20 | Global and regional crop yield targets (t/ha/yr)

Region

2017

2030 Target (% Change)

2050 Target (% Change)

Historical Average Annual Change, 2012–17

Average Annual Change Target, 2017–30

Average Annual Change Target, 2017–50

Asia (excluding China and India)

7.5

7.8 (3.8%)

9.4 (24.5%)

0.26

0.02

0.06

Brazil

13.7

16.6 (20.9%)

19.3 (40.0%)

-0.05

0.22

0.17

United States and Canada

6.5

6.5 (0.2%)

7.4 (14.0%)

0.24

0.00

0.03

China

9.6

10.9 (14.0%)

13.9 (45.3%)

0.11

0.10

0.13

Former Soviet Union

4.1

4.0 (0.0%)

4.5 (9.6%)

0.11

0.00

0.01

India

5.0

6.6 (34.3%)

8.8 (78.4%)

0.01

0.12

0.12

Latin America (excluding Brazil)

7.6

8.0 (5.6%)

9.5 (25.0%)

0.19

0.03

0.06

Middle East and North Africa

6.1

7.7 (20.8%)

9.4 (54.3%)

0.11

0.12

0.10

Other OECD

5.5

5.1 (0.0%)

5.5 (1.0%)

0.12

0.00

0.00

Sub-Saharan Africa

3.0

4.6 (53.2%)

6.6 (117.6%)

0.01

0.12

0.11

European Union

7.9

7.8 (0.0%)

9.1 (15.7%)

0.19

0.00

0.04

World

6.5

7.4 (13.3%)

9.0 (38.4%)

0.11

0.07

0.08

Global acceleration needed


On track; sustain action

On track; sustain action

Notes: Yields are weighted averages across all crops, as given in FAO (2020). Outlying observations (e.g., in former Soviet Union) are likely due to data limitations rather than being truly representative of conditions.

Sources: FAO (2020) for years 2012–17; GlobAgri-WRR model in Searchinger et al. (2019) for 2030 and 2050 targets.

Yield gains would be necessary across all world regions relative to the year 2017 (Table 20), with particular attention in areas like sub-Saharan Africa and India where current yields are well below the global average and where climate change without adaptation is expected to significantly depress yields (Porter et al. 2014; Verhage et al. 2018). Globally, the world would need to boost yields by nearly 40 percent, which would reduce cropland use by roughly 210 Mha and reduce land use change emissions by about 1.8 GtCO2e/yr between 2017–50 relative to “business as usual” (Searchinger et al. 2019). Crop yield data are available from FAOSTAT.

At the world level, crop yields grew by 0.11 tonnes per hectare per year (t/ha/yr) between 2012 and 2017, or slightly above the 0.08 t/ha/yr rate of change needed between 2017 and 2050. While this is encouraging, two caveats are necessary. First, this global growth represents an enormous amount of effort by farmers, agricultural researchers, and others, and just maintaining the necessary level of improvement for another three decades, in a changing climate, will be a major undertaking. Therefore, investment to increase crop breeding budgets, and increase support for improved soil and water management practices, remains essential, especially in regions where progress is slower. Second, the recent global growth masks wide variation between regions. In particular, sub-Saharan Africa, whose crop yields in 2017 were the lowest in the world, saw slow annual growth in crop yields from 2012 to 2017 (only 0.01 t/ha/yr), especially when compared to the regional target of 0.11 t/ha/yr between 2017 and 2050 to meet projected growth in food demand without increasing pressure on remaining natural ecosystems.

Indicator 3: Productivity of ruminant meat production (kg/ha/yr)

2030: increase of 27 percent above 2017 level

2050: increase of 58 percent above 2017 level

This indicator is measured as the weight of meat produced from ruminant livestock (cows, sheep, buffalo, goats) per hectare of pasture per year. Population and income growth, concentrated in the developing world, where consumption levels currently are relatively low, mean that demand for ruminant meat (and dairy products) is likely to grow even more than demand for crops.

Pastureland currently accounts for about two-thirds of all agricultural land (FAO 2011b). Searchinger et al. (2019) estimated that in a business-as-usual scenario, pasture could expand by roughly 400 million hectares between 2010 and 2050. Such an area (larger than the size of India) would put forest protection and restoration goals out of reach. Improvements in livestock production efficiency and pasture productivity can increase meat and milk production while reducing the pressure to clear more land for grazing. Sustainable intensification strategies include improvements to pasture grasses and supplemental feeds, animal breeds, veterinary care, and management practices (e.g., rotational grazing).

Productivity improvements would be required across all world regions (Table 21). At a global scale, the pace of productivity gains between 2017 and 2050 would need to be even faster than between 2012 and 2017, a period that saw a 5 percent increase in ruminant meat production per hectare of pasture (FAO 2020). Because much of the world’s pastureland is dry or sloped, achieving a global goal of a nearly 60 percent increase in ruminant meat production per hectare by 2050 would require improvements on nearly every suitable hectare of wetter pastureland. This achievement would reduce pastureland use by roughly 110 Mha and reduce land use change emissions by about 1.1 GtCO2e/yr between 2017 and 2050 relative to “business as usual” (Searchinger et al. 2019).

Ruminant meat production and pastureland extent data are available from FAOSTAT, but data on pasture area are currently of poor quality. Comparisons between national-level pasture area data in FAOSTAT and satellite analyses show large discrepancies both in the precise areas designated as pasture and in the net pasture areas (Oliveira et al. 2020; Fetzel et al. 2017). Although there is clear evidence of clearing of tropical forest for pasture—suggesting that combining pasture productivity improvements with forest protection is a necessary strategy to meet food, forest, and climate goals—analyses of pasture area must be improved to hone targets and track progress.

Indicator 4: Food loss and waste (kg/capita/yr)

2030: 25 percent reduction below 2017 level

2050: 50 percent reduction from 2017 level

Roughly one-third of all food produced in the world each year (by weight) is lost or wasted between the farm and the fork (FAO 2011a) (Figure 45), resulting in high economic losses, contributing to food insecurity in lower-income countries, adding to GHG emissions, and representing a “waste” of agricultural land and water resources. Sustainable Development Goal Target 12.3 calls for reducing per capita global food waste at the retail and consumer levels by 50 percent and reducing food losses (including postharvest losses) where possible along production and supply chains (UN 2015). In lower-income countries, food loss and waste tends to occur closer to the farm, while in higher-income countries it occurs closer to the fork—although supply chain disruptions related to COVID-19 also caused significant losses in higher-income countries in 2020 (FAO 2020).

Because of the many complexities across regions and supply chains and gaps in food loss and waste data, we have set equal targets of 25 percent reductions in rates of food loss and waste across all regions by 2030 and 50 percent by 2050 (Table 22). Reducing food loss and waste by 50 percent by 2050 would reduce agricultural land demand by about 310 Mha and annual agriculture and land use change emissions by roughly 3 GtCO2e, relative to “business as usual” (Searchinger et al. 2019).

Global- and country-level monitoring data are not yet available for this indicator, but FAO and partners are developing a Food Loss Index and Food Waste Index to measure countries’ progress over time. A preliminary Food Loss Index estimate by FAO suggests that, globally, 14 percent of food production is lost from the postharvest stage up to, but not including, the retail stage of the food supply chain (FAO 2019). The Food Waste Index will measure retail- and consumption-level food waste.

Indicator 5: Ruminant meat consumption (kcal/person/day)

2030: limit increase to 5 percent from 2017 level

2050: limit increase to 6 percent from 2017 level

As incomes rise and people move to cities, diets tend to become more varied and higher in resource-intensive foods like meat and dairy. For this reason, consumption of animal-based foods is projected to grow by nearly 70 percent between 2010 and 2050 (Searchinger et al. 2019), an estimate roughly in line with several other researchers’ estimates (e.g., Willett et al. 2019; Tilman and Clark 2014; Springmann et al. 2016). This projected growth makes forest protection and climate mitigation goals much more challenging: for instance, beef production requires 20 times more land and leads to 20 times more GHG emissions per gram of protein than beans. Beef and other ruminant meat production is also roughly seven times as land- and GHG-intensive as poultry and pork production (Ranganathan et al. 2016).

Modest increases in consumption of animal-based foods can boost nutrition in low-income countries. However, in high-income countries, where protein consumption is well above dietary requirements and substitutes for animal protein are widely available, shifting diets toward plant-based foods and especially away from beef and lamb can reduce agricultural land demand and GHG emissions. While additional shifts away from animal-based foods beyond ruminant meats (e.g., pork and poultry) in high-income countries have been recommended by other researchers for environmental and health reasons (e.g., Willett et al. 2019), and could reduce cropland demand, such shifts require larger behavioral changes and do not confer the same relative land and GHG benefits as shifts from ruminant meat, so they are not the focus of this indicator.

If ruminant meat consumption in high-consuming countries declined by 2050 to 52 kcal/person/day, or about 1.5 burgers/person/week, it would reduce agricultural land demand by more than 500 Mha, and reduce agriculture and land use change emissions by more than 5 GtCO2e, relative to “business-as-usual” (Searchinger et al. 2019). In China, for example, this goal would translate to higher consumption than in 2017 but lower than business-as-usual in 2050. For more than 5 billion people across sub-Saharan Africa and South Asia, this goal would allow for business-as-usual consumption growth—and projected 2050 consumption levels are shown in Table 23—but for those in Europe and the Americas it would mean decreases in consumption from today’s levels (Table 23).

Per capita ruminant meat consumption did decrease both at the global level (-3 percent) and in several world regions between 2012 and 2017 (FAO 2020), suggesting the feasibility of achieving the global target even as incomes rise. It is also notable that in the United States and Europe, per capita beef consumption has already receded by more than one-third from peak levels in the 1970s (FAO 2020). However, the global trend from 2012 to 2017 hides regional variation. Ruminant meat consumption is unequally distributed across the world (Table 23), with people in Europe and the Americas comprising 25 percent of the world’s population while consuming more than half of all ruminant meat (Searchinger et al. 2019). The 2030 and 2050 targets in Table 23 promote greater equality of consumption while keeping per capita consumption relatively steady at the global level. The trend from 2012 to 2017 shows that regions like North America, Europe, Brazil, and China are not yet on track for the 2050 regional targets, while lower-income, low-meat-consuming regions such as sub-Saharan Africa actually reduced consumption even though their 2050 regional target allows for growth. Therefore, the period 2012–17 reflects progress toward the global target but without addressing equality of consumption among regions.

Ruminant meat “availability” data (a proxy for consumption) are available from FAOSTAT’s food balance sheets, but because “availability” includes a small amount of food that is thrown away at the household level, we have set the maximum threshold target slightly higher, at 60 kcal/person/day for all regions above this threshold, to achieve by 2050. Future data improvements could draw from estimates of actual dietary intake from national diet surveys (Micha et al. 2015), provided they can be standardized across countries. These surveys also have the advantage of showing differences in intake within national populations (e.g., by gender or age), but they are subject to their own limitations, such as underreporting of calorie consumption (Archer et al. 2013).

Start reading