report

State of Climate Action

Assessing Progress toward 2030 and 2050

Partners:
Download PDF

Endnotes

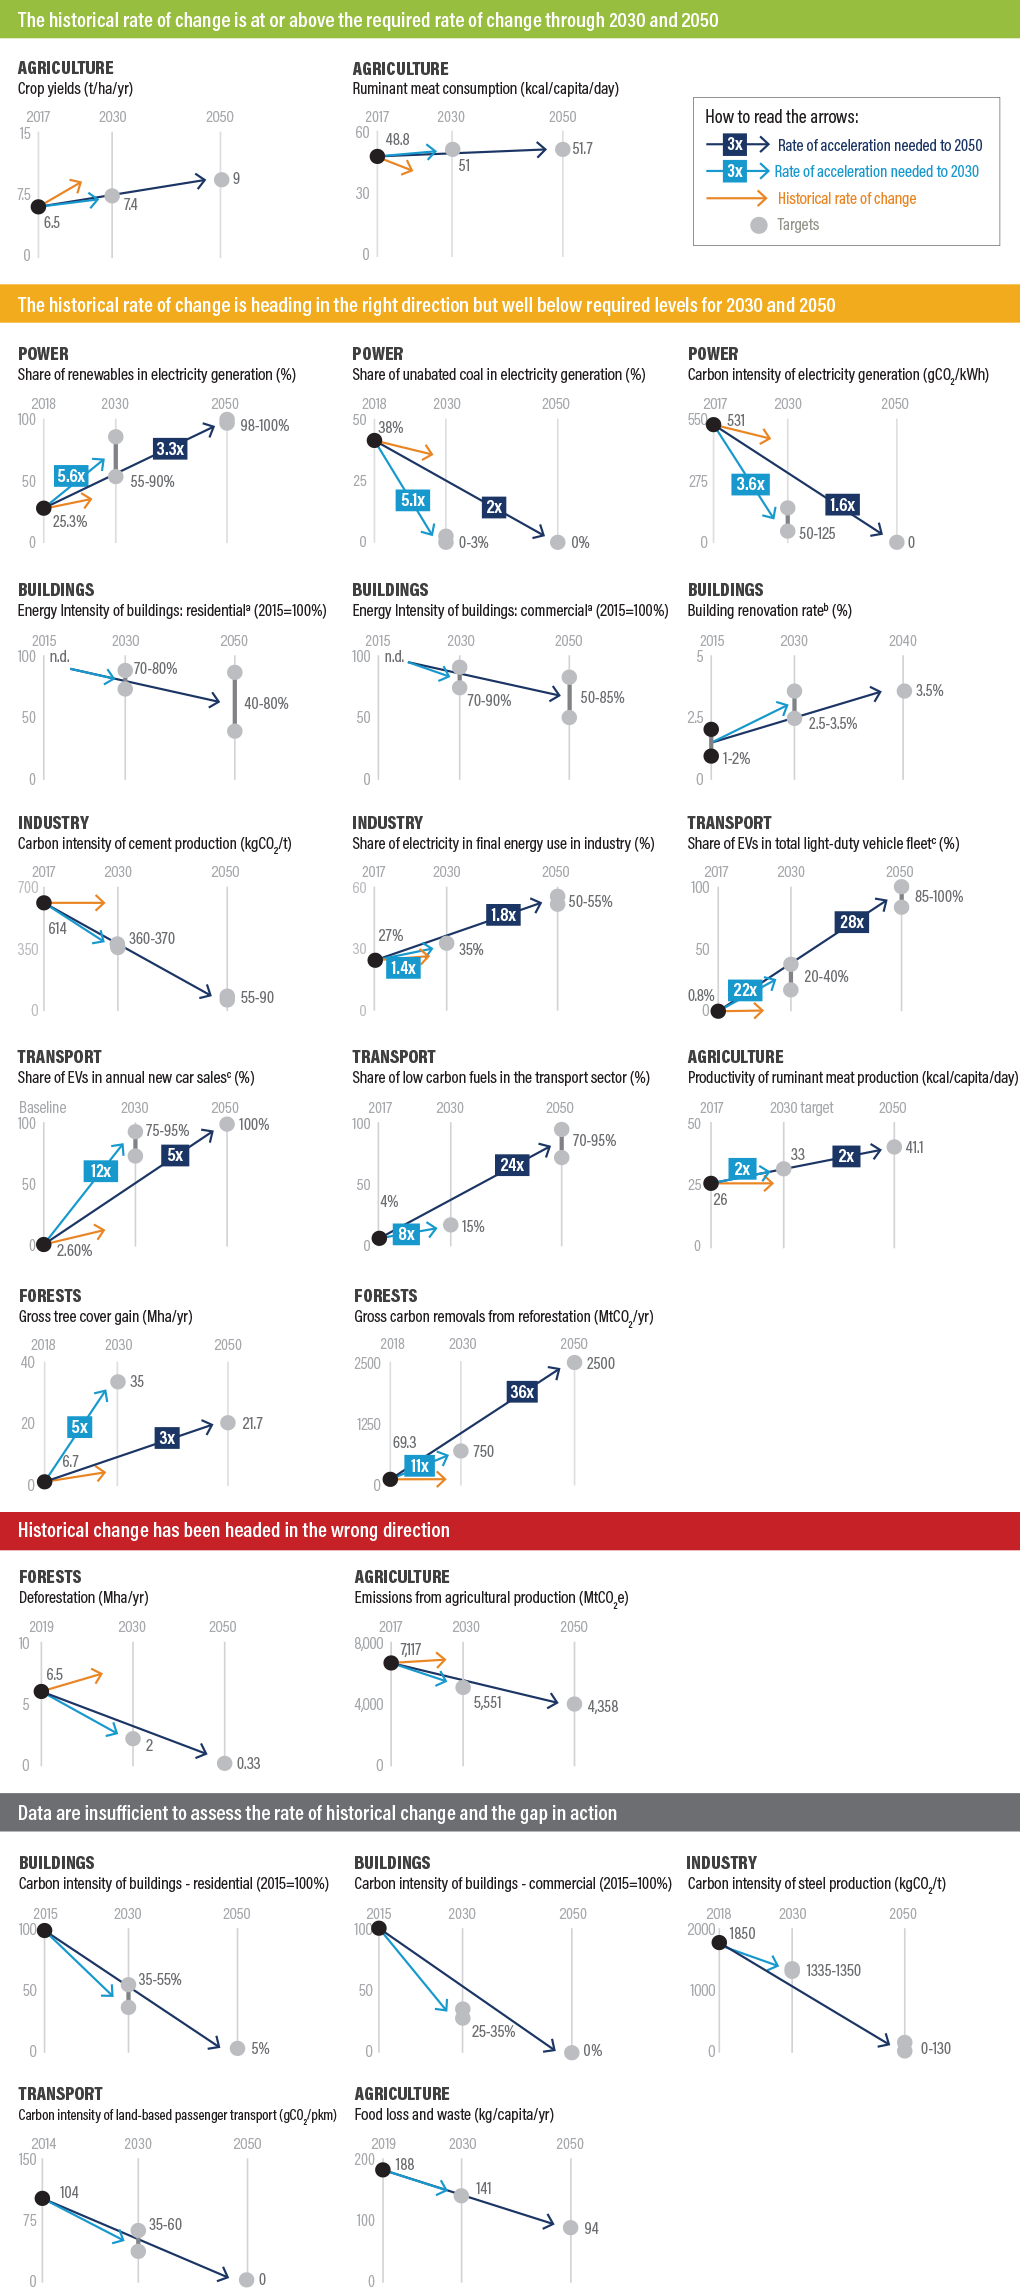
  1. 1. Installed capacity refers to the potential electricity generation a facility could produce if it were to run at full capacity. Generation refers to the actual electricity produced during a time period. Even if capacity is installed, it might not generate electricity, leading to lower emissions and the power plant becoming less economically viable.
  2. 2. Based on the Climate Action Tracker (CAT), this emission intensity can include biomass with carbon capture and storage (BECCS). CAT benchmarks are not prescriptive in terms of how targets are reached; they indicate only that targets are compatible with the Paris Agreement. BECCS in particular remains uncertain as there are currently no large-scale, commercially viable options. BECCS can also have knock-on effects on other sectors, like land use emissions, that are not further covered here. BECCS included in integrated assessment models can be part of the possible solutions to reduce the carbon intensity of the electricity sector to zero, particularly beyond 2030. For the benchmarks, CAT has filtered the full scenario range based on sustainability criteria established by the Intergovernmental Panel on Climate Change (IPCC); namely, BECCS and reforestation and afforestation. The use of BECCS is therefore limited in the scenarios considered.
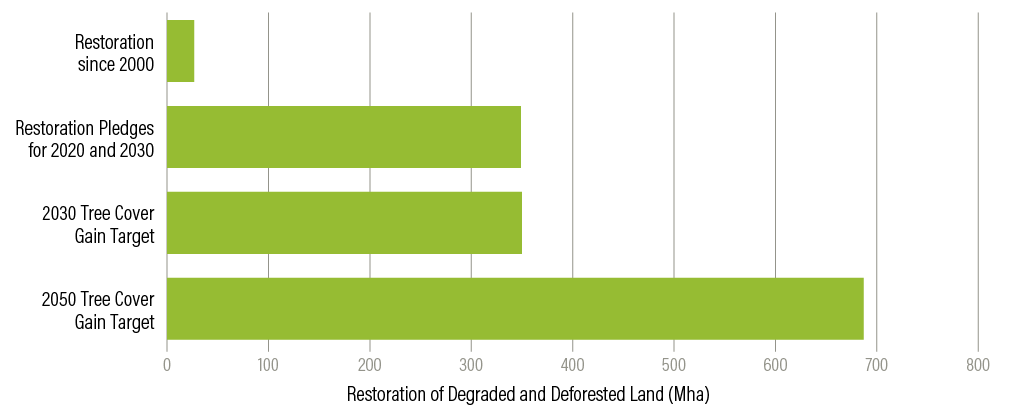
  3. 3. Regional commitments like AFR100 (to restore 100 Mha of degraded land in Africa by 2030), Initiative 20x20 (to restore 20 Mha of degraded land in Latin America), and ECCA 2030 (to restore 30 Mha of degraded land in Europe, the Caucasus, and Central Asia by 2030) also feed into these global goals.
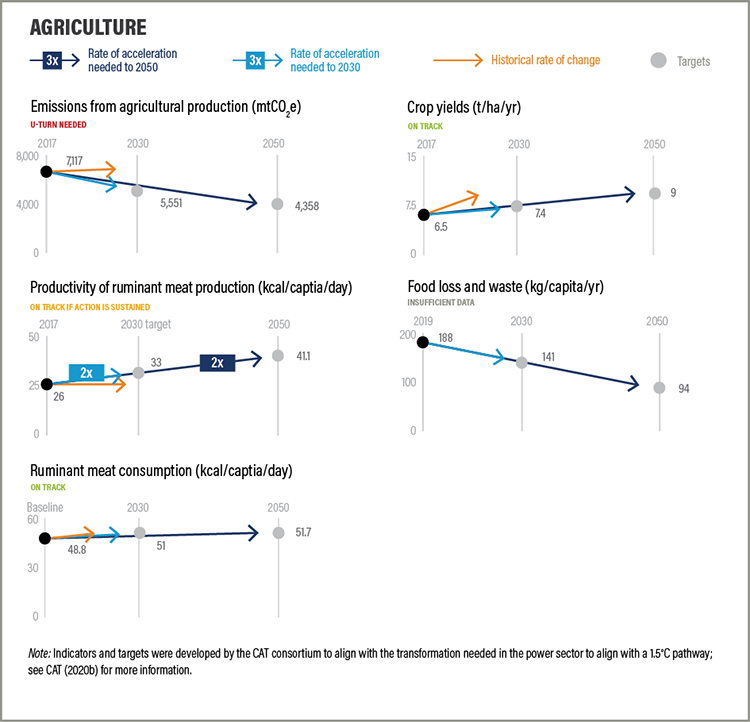
  4. 4. Searchinger et al. (2019) modeled a number of global food production and consumption scenarios in 2050 and found that even under very ambitious scenarios it was not possible to keep agricultural production emissions below 4 GtCO2e while adequately feeding 9–10 billion people. Further reductions in land sector emissions would need to come from large-scale forest restoration (see Forests section). This 2050 target is also similar to the 5 GtCO2e/yr agricultural greenhouse gas (GHG) target defined in the EAT-Lancet Commission report (Willett et al. 2019).
  5. 5. Carbon dioxide is reduced to net zero by 2050 and total GHG emissions reach net zero by 2063–68 on average for 1.5°C scenarios with low or no overshoot of 1.5°C.
  6. 6. Prior to COP26, all countries are invited to raise their ambition under the Paris Agreement.
  7. 7. The Initiative for Climate Action Transparency (ICAT) has developed a methodology and tool for assessing the potential GHG emissions reductions from nonstate and subnational commitments and actions. The application and use of the ICAT tool can support deeper understanding of how cities, as well as businesses and other actors, are contributing to national ambition.
  8. 8. Due to space limitations, the section does not cover the state of adaptation by geography, across sectors, in the private sector, or by key aspects of adaptation such as climate information services, monitoring, evaluation and learning, knowledge about good practices, or financial tools.
  9. 9. CAT refers to “targets” as “benchmarks” in its report and methodology. See CAT (2020a, 2020b).
  10. 10. SIAMESE, or the Simplified Integrated Assessment Model with Energy System Emulator.
  11. 11. Targets were calculated on the basis of EU28, before the United Kingdom left the European Union.
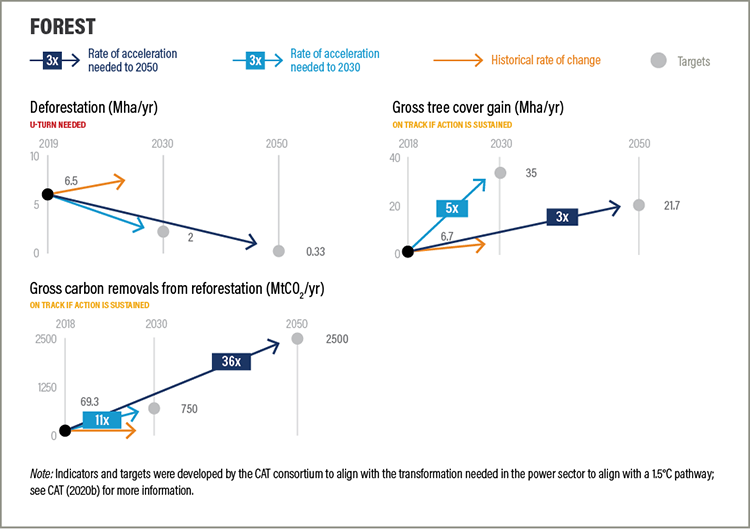
  12. 12. For the forest sector we use the last 19 years because the highest levels of deforestation were in 2015 and 2016, so looking at the last five years gives a somewhat distorted view that doesn’t account for the general increase over time but would only consider a slight decrease from a recent peak.
  13. 13. The electricity (or power) sector includes electricity generation and is part of the larger energy sector, which also includes transport, manufacturing, and buildings.
  14. 14. The remaining carbon budget to stay within 1.5°C with probability of 66 to 50 percent (420–580 gigatonnes CO2) is based on Rogelj et al. (2018).
  15. 15. This depends on how externalities are valued.
  16. 16. The IEA reports that renewable sources include electricity from hydro, geothermal, solar, wind, tide, wave, biofuels, and the renewable fraction of municipal waste. This will be the definition used in this section if not otherwise stated.
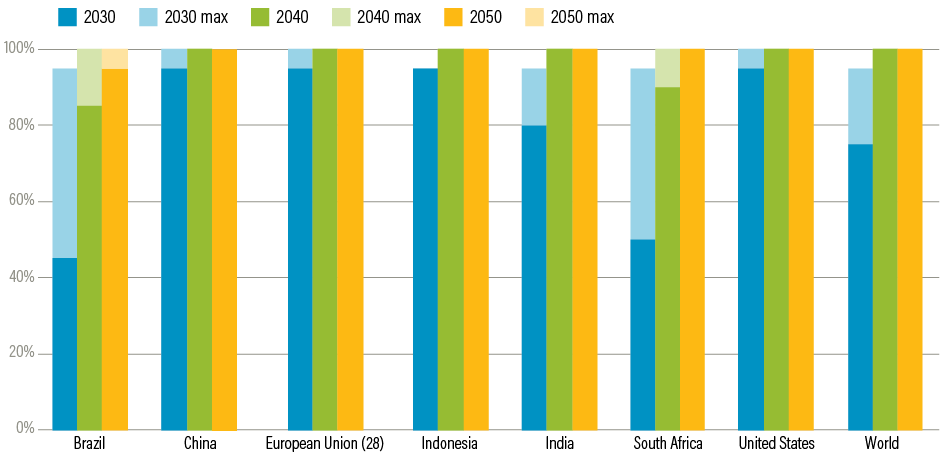
  17. 17. Based on CAT (2020b), for the power sector the “Paris Agreement–compatible benchmarks for these indicators reflect a synthesis of the values in the chosen interval years (2030, 2040, 2050) of the 75th percentile across the Paris Agreement–compatible pathways analysed and the highest level of ambition found to be viable in the relevant literature.”
  18. 18. For example, through the Net-Zero Asset Owner Alliance.
  19. 19. The uncertainty about the use of CCS in scenarios is quite large. CAT targets assume that a large share of this modeled CCS-based power generation could be renewables.
  20. 20. Installed capacity refers to the potential electricity generation a facility could produce if it were to run at full capacity. Generation refers to the actual electricity produced during a time period. Even if capacity is installed, a power plant might not generate electricity, leading to lower emissions and the power plant’s becoming less economically viable.
  21. 21. Emissions associated with construction are covered by the cement and steel benchmarks in the Industry section.
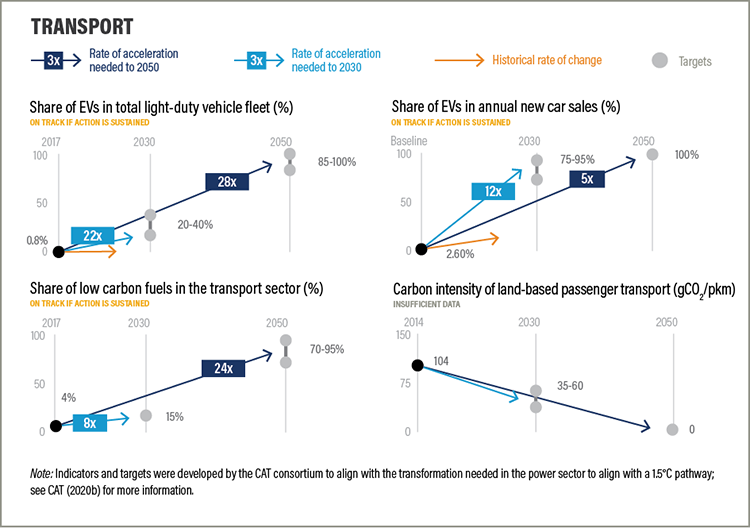
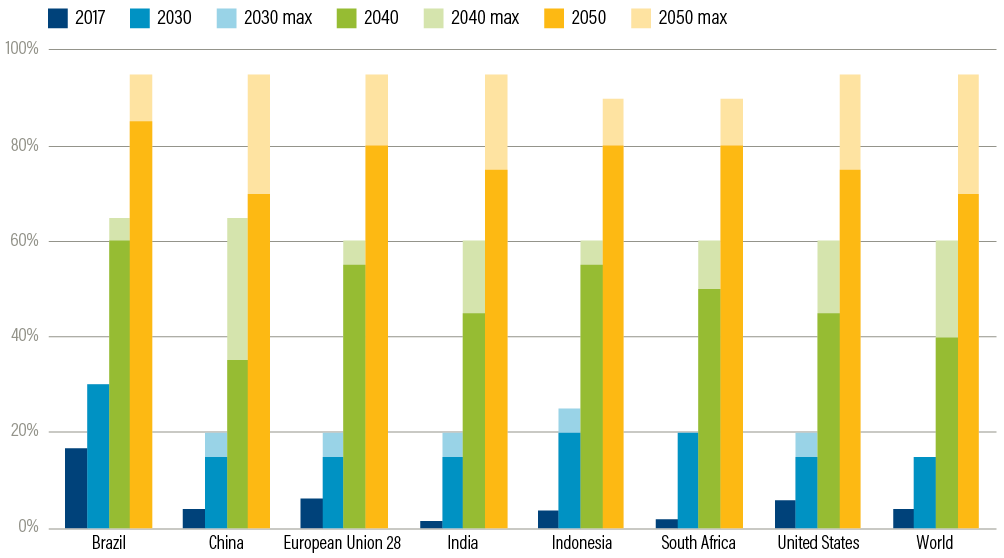
  22. 22. In the Global EV Outlook (IEA 2020c), the share also includes plug-in hybrid EVs in the passenger LDVs, which is a larger scope than the target.
  23. 23. In the Global EV Outlook (IEA 2020c), “electric cars” also include plug-in hybrid EVs in the passenger LDVs, which is a larger scope than the target.
  24. 24. The behavior changes will not be reflected in this indicator, however, as it covers only passenger transport.
  25. 25. These targets come from a survey and reconciliation of median estimates of top-down models (integrated assessment models) and bottom-up assessments in the literature that are then divided into a set of mitigation measures based on feasibility and sustainability. The 70 percent and 95 percent reduction targets refer to gross forest loss reductions as well as the subset of that gross number that is permanent deforestation.
  26. 26. Both targets divide the cumulative target by the number of years from 2020 to the target year to establish an annual target for rate of change comparison.
  27. 27. Regional commitments like AFR100, to restore 100 Mha of degraded land in Africa by 2030, Initiative 20x20, to restore 20 Mha of degraded land in Latin America, and ECCA 2030, to restore 30 Mha of degraded land in Europe, the Caucasus and Central Asia by 2030, also feed into these global goals.
  28. 28. Searchinger et al. (2019) modeled a number of global food production and consumption scenarios in 2050 and found that even under very ambitious scenarios it was not possible to keep agricultural production emissions below 4 GtCO2e while adequately feeding 9–10 billion people. Further reductions in land sector emissions would need to come from large-scale forest restoration (see Forests section above). This 2050 target is also similar to the 5 GtCO2e/yr agricultural GHG target defined in the EAT-Lancet Commission report (Willett et al. 2019).
  29. 29. FAOSTAT emissions adjustments in Searchinger et al. (2019) included a higher global warming potential value for methane (34 kg of CO2e) based on the most recent IPCC recommendations, and a higher amount of agricultural energy use calculated by the GlobAgri-WRR model based on estimates from the U.S. Environmental Protection Agency and FAO.
  30. 30. This report considers all crops tracked in FAOSTAT. According to FAO (2020), these include cereals, coarse grains, fruits, jute and jute-like fibers, oil crops, pulses, roots and tubers, treenuts, and vegetables.
Start reading