report

State of Climate Action

Assessing Progress toward 2030 and 2050

Partners:
Download PDF

Executive Summary

This report provides an overview of climate action to date and assesses global and country-level progress across benchmarks for six sectors that would limit global warming to 1.5 degrees Celsius (°C) and therefore prevent its most dangerous impacts. We found that while advancements are happening within some sectors, for most the rate of change is much too slow for the world to achieve these goals.

Ali Catteral/Unsplash

Highlights

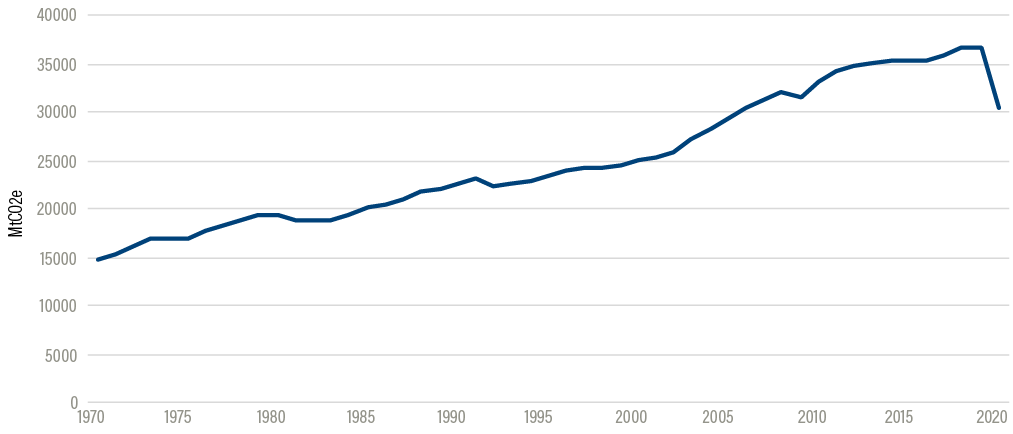
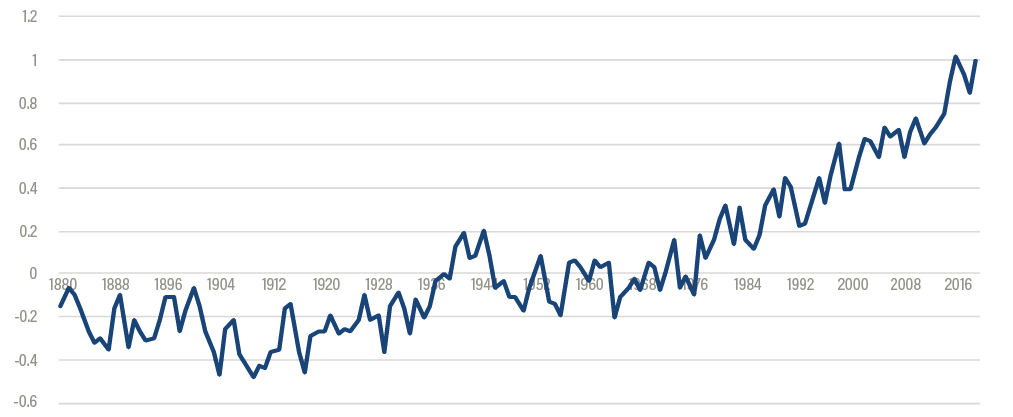
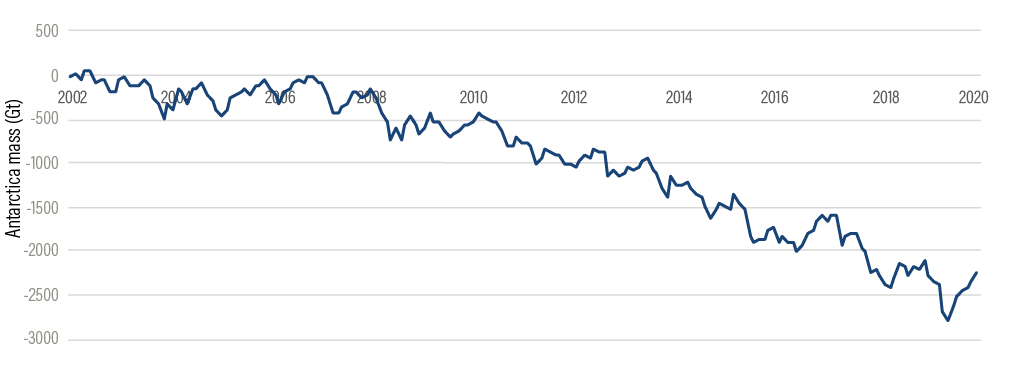
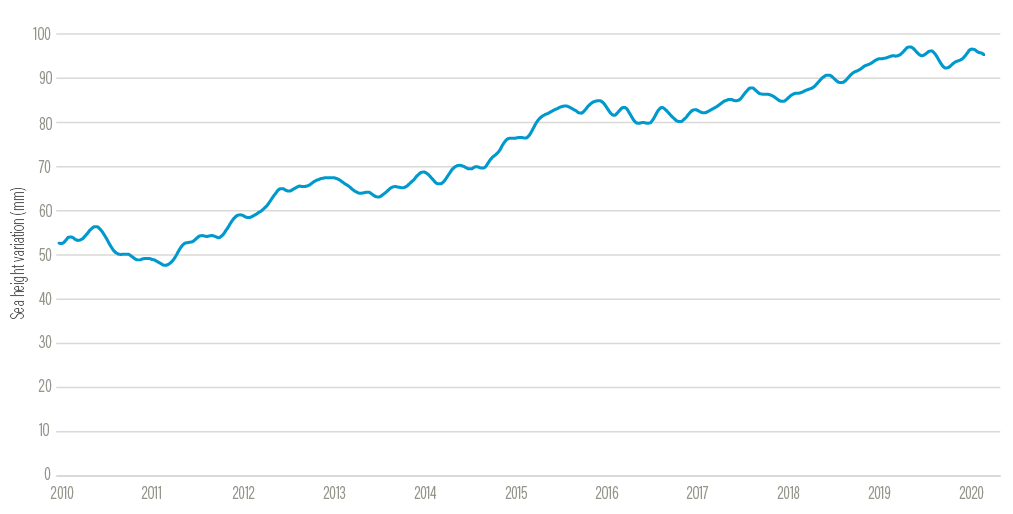
  • The world is already being ravaged by the impacts of a changing climate—from the spread of fires to more intense storms, heat waves, the breakup of ice sheets, and disappearing glaciers.
  • Commitments and action by countries, cities, and companies, as well as levels of climate finance, still fall woefully short of the ambition necessary to meet the Paris Agreement’s goals.
  • This report assesses progress toward 2030 and 2050 emissions-reduction targets in the power, buildings, industry, and transport sectors, based on indicators and targets designed by the Climate Action Tracker (CAT) consortium, and in the forests and agriculture sectors, based on indicators and targets designed by World Resources Institute (WRI).
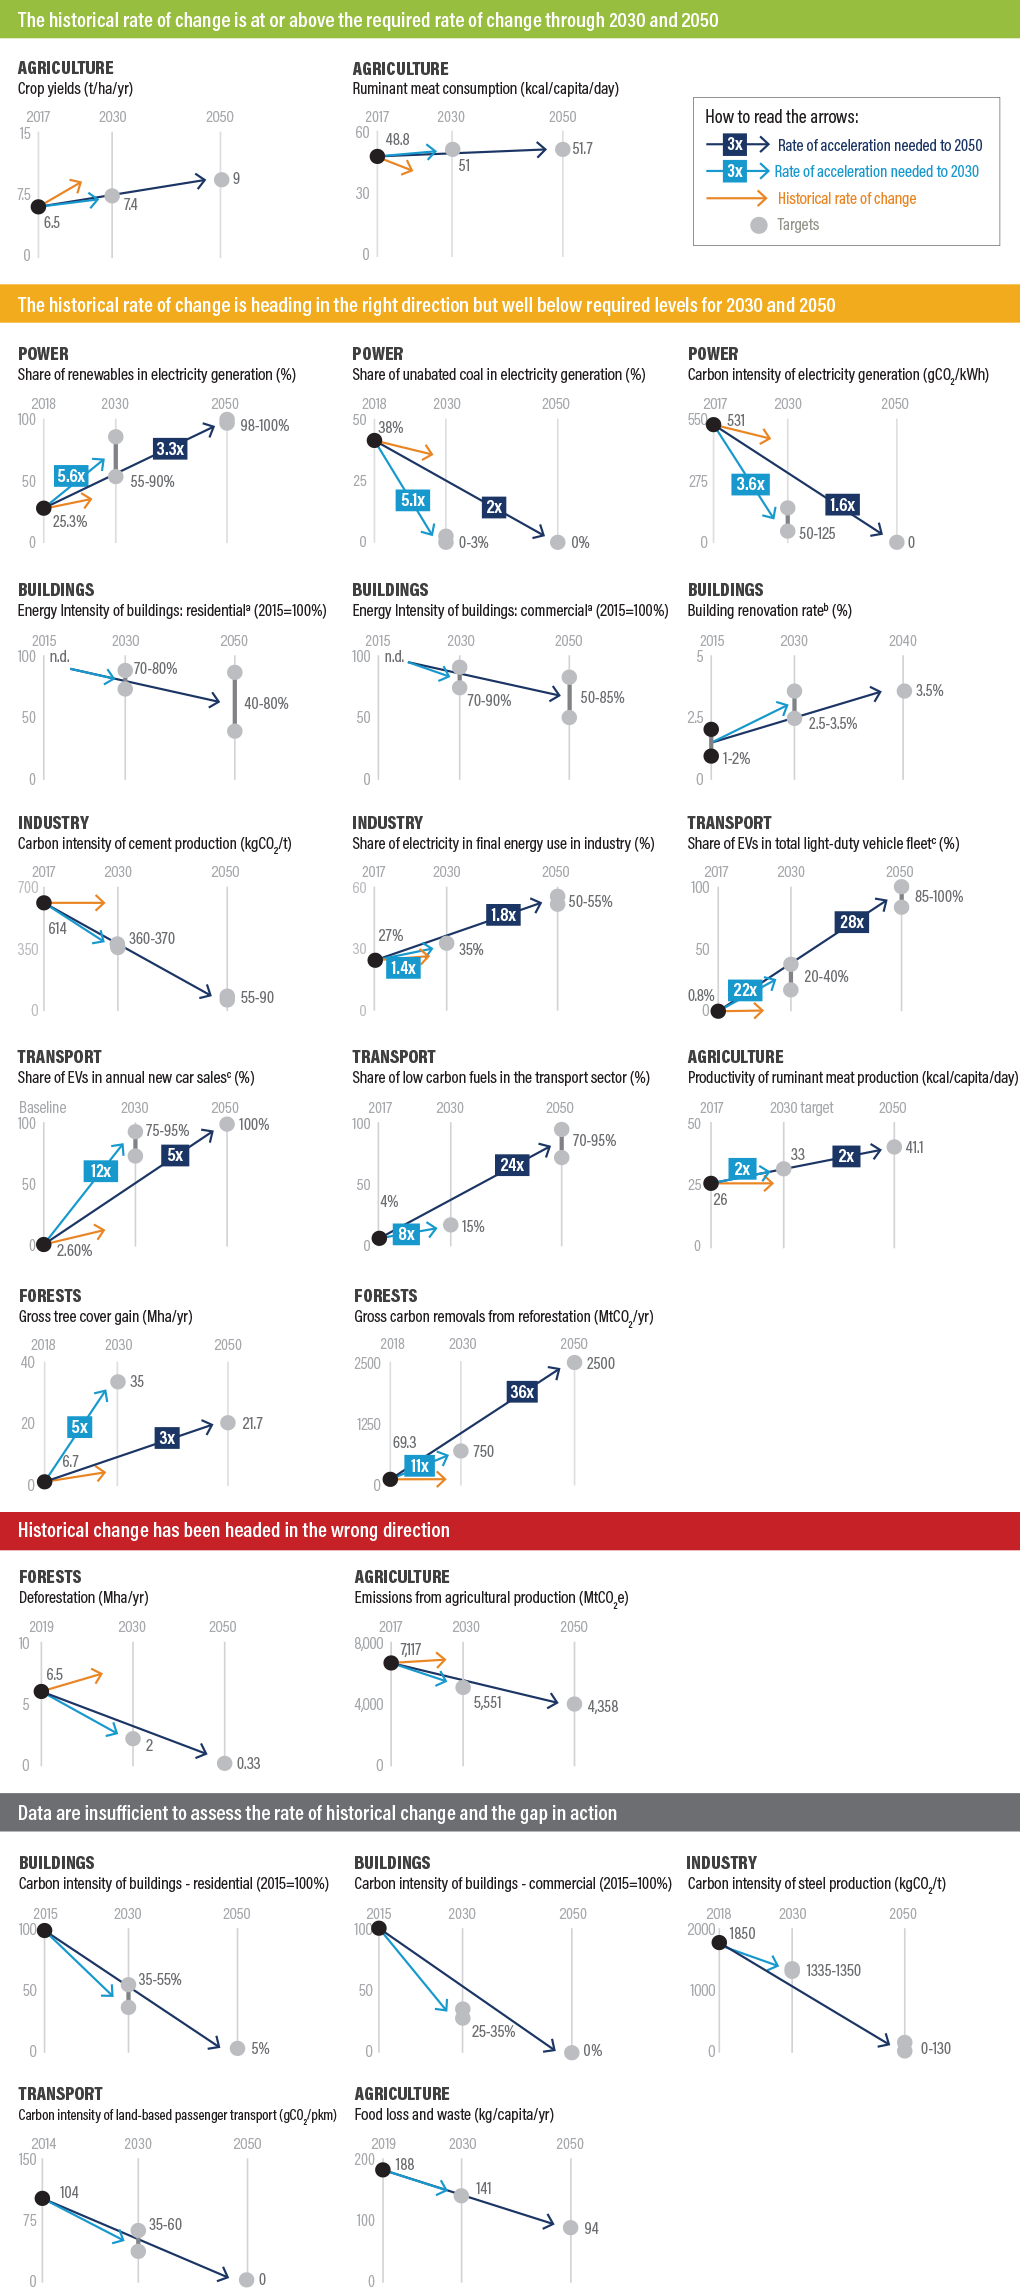
  • Of the 21 indicators assessed, 2 show a historical rate of change that is sufficient to meet both 2030 and 2050 targets, 13 indicators show change headed in the right direction but too slowly, and 2 show change headed in the wrong direction altogether. Data are insufficient to assess progress in 4 indicators.
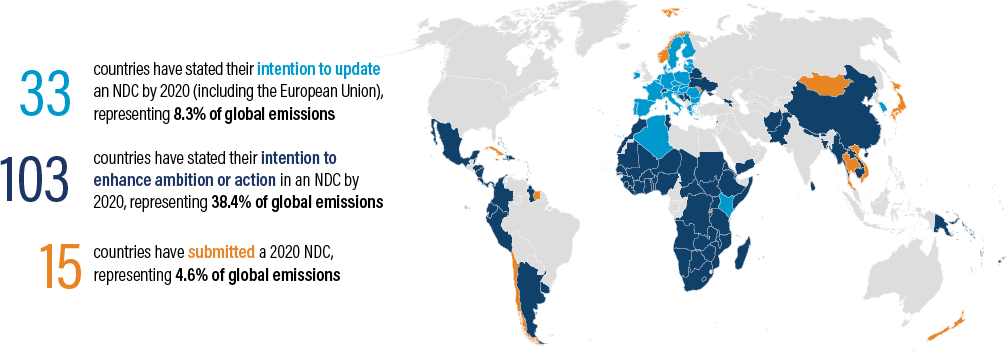
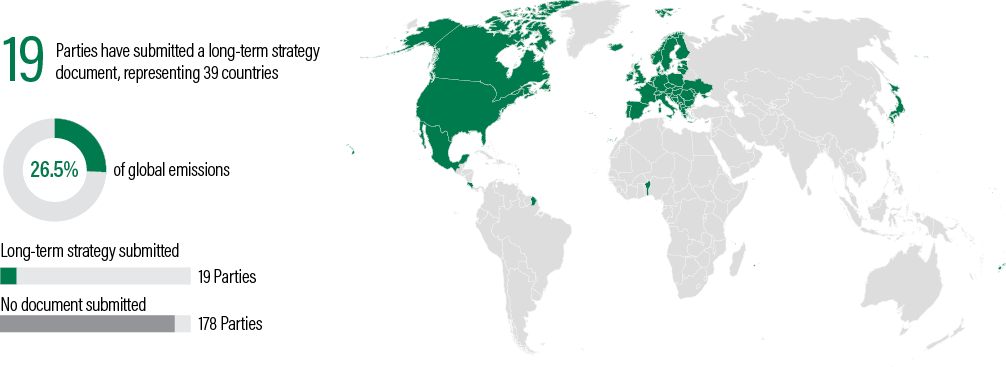
  • This coming year, leading up to the 26th Conference of the Parties (COP26), is critical to commit to transformative action to limit warming to 1.5°C. Countries will update their nationally determined contributions (NDCs) under the Paris Agreement and submit long-term strategies, at the same time that trillions of dollars will be mobilized for COVID-19 recovery.

Context

The decisions countries make in the lead-up to COP26 on future climate commitments could lock us into a carbon-intensive trajectory or help steer us toward one that avoids the worst climate impacts and increases resilience. We have a narrow window of time to change direction. Countries are invited this year to update their national climate pledges (known as nationally determined contributions, or NDCs) and develop long-term low-emissions development strategies. As governments seek to rebuild their economies and societies in response to COVID-19, recovery packages could lock us into a carbon-intensive trajectory and compound the challenges we are already confronting. An understanding of what different sectors can and should contribute to climate mitigation through midcentury will help guide the necessary actions of transitioning to a low-carbon society.

We should consider this next decade as our decisive decade to change our course to arrive at a different low-carbon future by midcentury. A sole focus on action through 2030 may achieve short-term goals but could ultimately lead to a more carbon-intensive pathway that does not embrace the deep decarbonization required to limit warming to 1.5°C. A sole focus on 2050, however, may not deliver the required shorter-term reductions needed to achieve feasible decarbonization rates and avoid lock-in of carbon-intensive infrastructure, technologies, and behavior.

For the majority of sectors, the required transformations are a significant departure from our current level of climate action and our everyday investments, behavior, technologies, and decision-making. And given that our ever-shrinking carbon budget does not accommodate delay, this level of change will require scaling finance, technology transfer, and capacity building for countries needing support. These transformations must be just and accompanied by measures that support those who will be most adversely affected.

About This Report

This report provides an overview of how we are collectively doing in addressing the climate crisis. Taking stock of change to date is critical for informing where best to focus our attention and change our future course of action. The report starts with a snapshot of the latest climate impacts, then describes the state of national, subnational, and corporate climate mitigation commitments, climate finance, and adaptation action. Following this discussion, this report assesses the pace of action on mitigation to date in key sectors and compares it with where we need to go by 2030 and by 2050 to limit warming to 1.5°C, and accordingly avoid the worst climate impacts. The report builds upon a previous assessment WRI conducted toward 2020 climate milestones (Ge et al. 2019) but extends it to 2030 and 2050. For this report, several indicators were identified that the literature suggests are the best ways to monitor sectoral decarbonization pathways. The targets presented in this report for power (energy), buildings, industry, and transport were developed by the Climate Action Tracker consortium, which provides independent analysis and comprises Climate Analytics and the New Climate Institute, and are designed to be compatible with limiting warming to 1.5°C. The forests and agriculture targets were developed by WRI and are also aligned with the 1.5°C goal. Given the longer time horizon, it is not possible to definitively say whether we are on or off track to meet our climate targets, but it is possible to measure the rate of progress to date and compare it with the rate of change required to meet 2030 and 2050 targets in an effort to inform future action. Progress toward targets is assessed at the global level as well as for key emitting countries: Brazil, China, EU28 (the European Union including the United Kingdom), India, Indonesia, South Africa, and the United States.

This report aims to support key governmental decision-makers, companies, investors, and funders who are considering where to accelerate action. A secondary audience is subject experts who support such decision-makers in strengthening implementation of existing commitments, as well as increasing ambition in the future.

Key Findings

Even with only 1°C of warming, the impacts of human-induced climate change are mounting already—from the spread of fires, to more intense storms, to heat waves. While numerous countries, cities, and companies have committed to greater emissions cuts, much greater ambition is needed if we are to meet the Paris Agreement’s objectives of limiting warming to 1.5–2˚C. Adaptation efforts are gaining traction, given the onset of impacts already happening across the globe, but greater resources are needed. While climate finance has increased significantly in recent years, it is not equal to the level needed to transform our energy system, protect our forests, and adapt to increasing impacts of climate change.

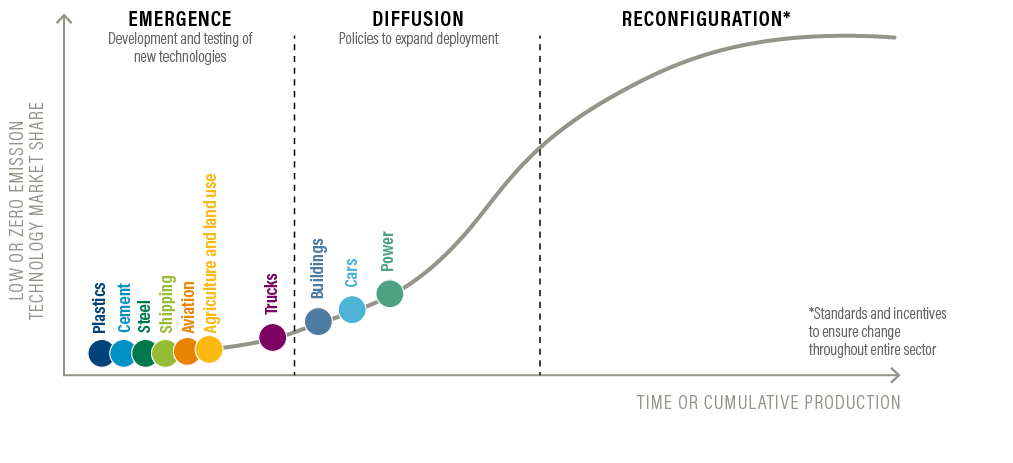
Progress on reducing emissions is uneven across indicators compatible with the Paris Agreement in key sectors (power, buildings, industry, transport, forests, and agriculture) (Box ES-1). While change will very likely not occur linearly, meaning that we cannot simply extrapolate from historical rates of change, comparing historical rates of change with the pace and scale of change that will be necessary in the future can shed light on the scale of action needed.

While national progress varies across countries, at a global level, the assessment of sectoral indicators is as follows:

  • Two of the 21 indicators assessed illustrate a historical rate of change that is at or above the required rate for achieving both 2030 and 2050 targets.
  • For 13 of the 21 indicators assessed, the historical rate of change is heading in the right direction but well below required levels for 2030 and 2050.
  • For 2 indicators, historical change has been headed in the wrong direction.
  • For 4 of the indicators assessed, data are insufficient to assess the rate of historical change and the gap in action.

Figure ES-1 | Summary of indicator assessment for sectoral emissions reductions

The following sections set out the indicators and targets for each sector, and the accompanying tables highlight these numbers as well as the historical rate of change for the indicator and the rates of change needed to achieve the 2030 and 2050 targets. We also quantify the gap between these two rates with global acceleration factors showing how much historical action would have to accelerate to meet the future needed rates of change. In some cases, the historical rate of change is moving in entirely the wrong direction, so the acceleration rate cannot be calculated—these are noted with “n.a.; U-turn” to indicate that the trajectory of change needs to reverse.

Power

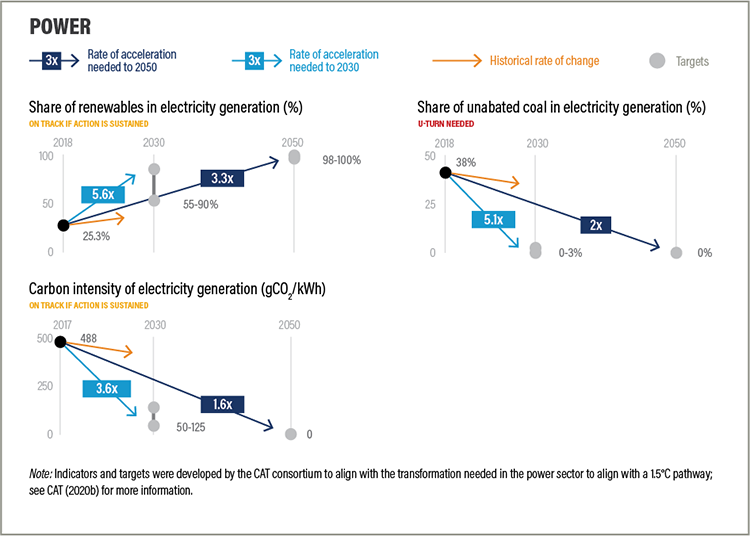
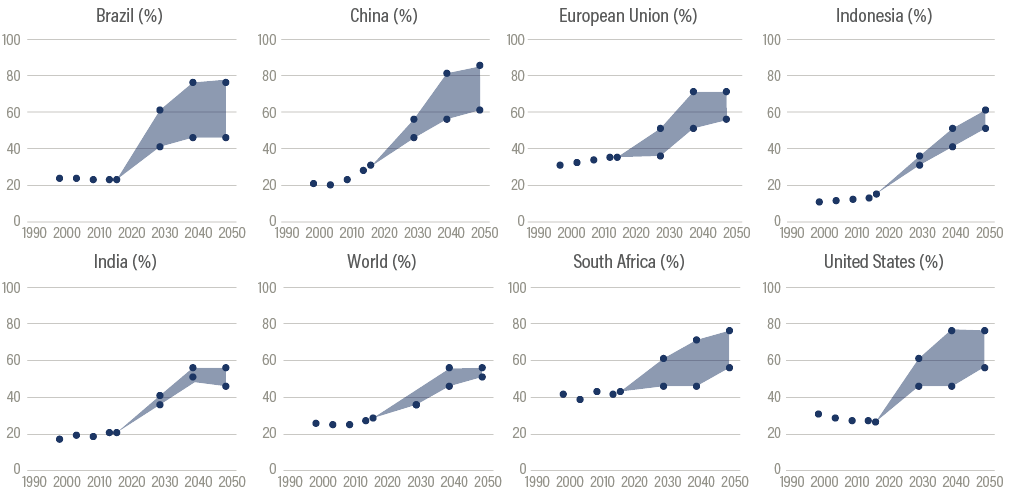
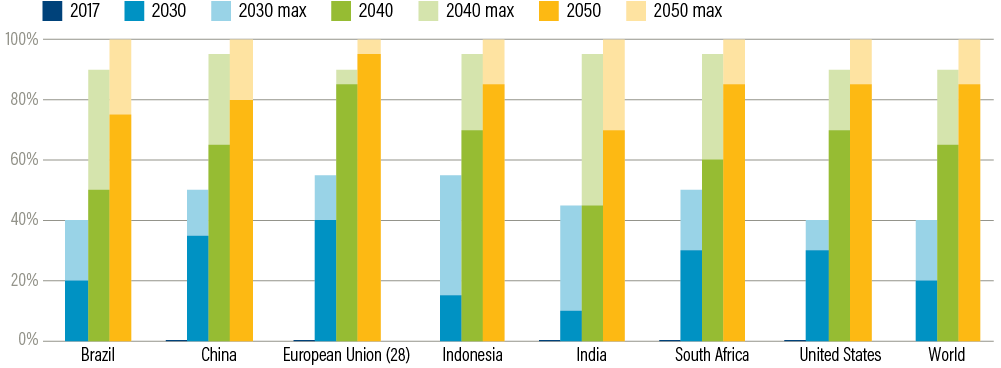
Indicator 1: Share of renewables in electricity generation (%)

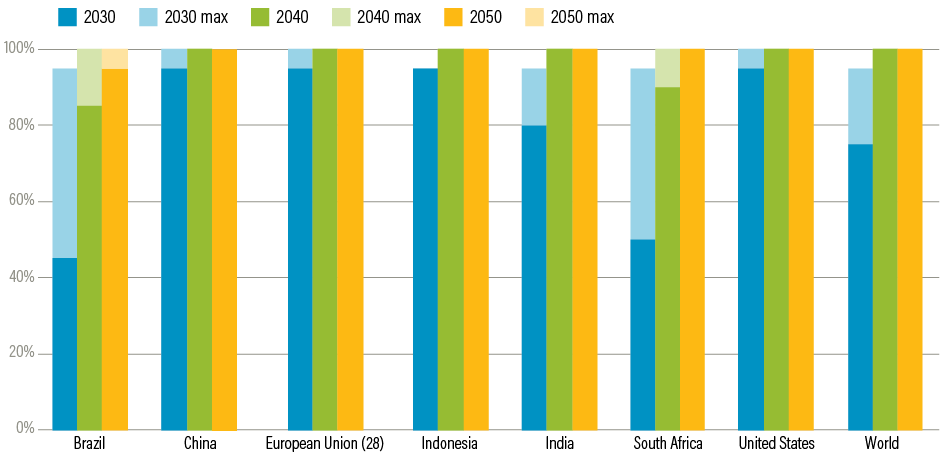
Target: Share of renewables reaches 55–90 percent by 2030 and 98-100 percent by 2050

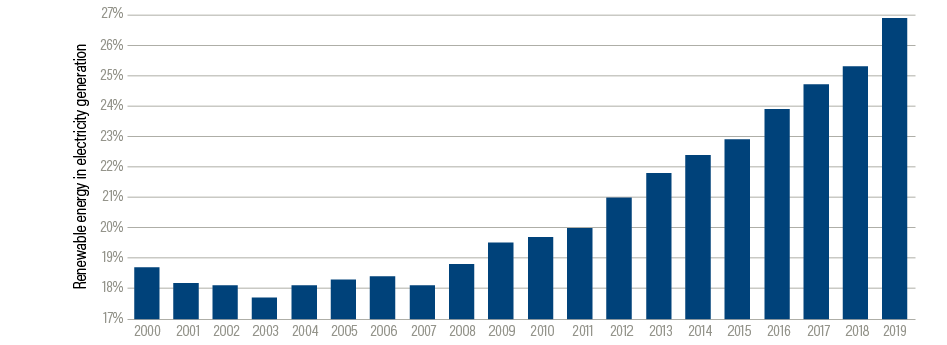
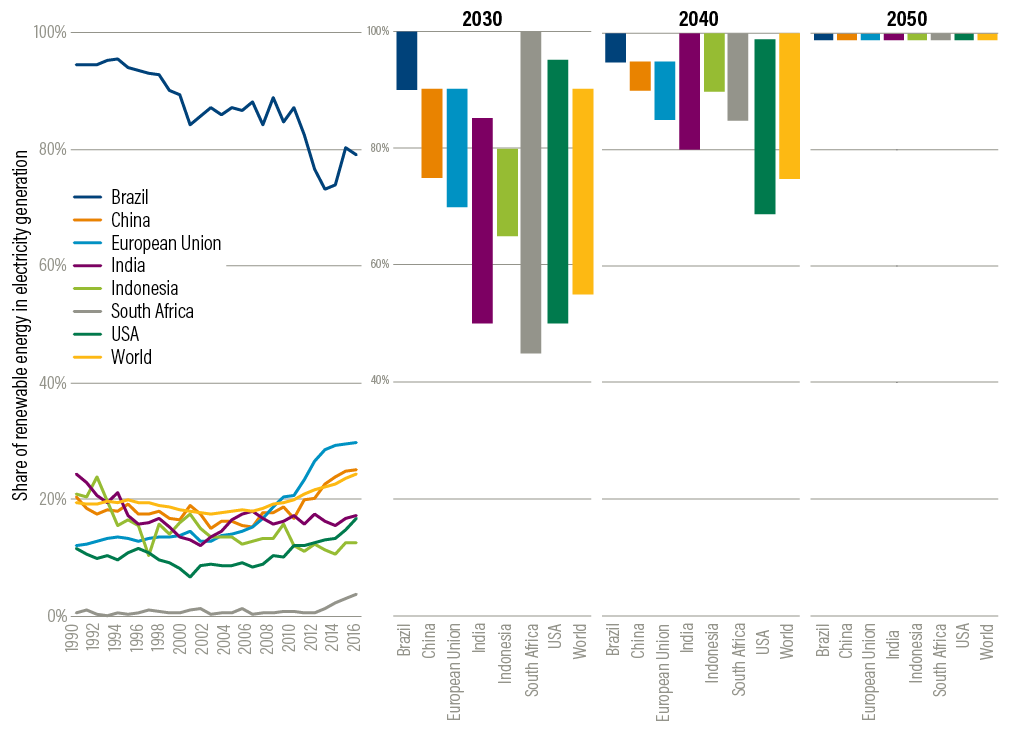
Renewable power—including hydro, geothermal, solar, wind, tide, wave, biofuels, and the renewable fraction of municipal waste—is now the generation technology of choice, making up 72 percent of new capacity in 2019. This shift has been driven by the rapid decline in the price of renewable generation technologies, particularly wind power and solar photovoltaics, and battery storage, as well as strong private sector demand coupled with national actions. The vast majority of countries have slowly increased the share of renewables in their power sector since 2005. However, to be aligned with a 1.5°C pathway countries will need to ramp up action (Table ES-1).

Table ES-1 | Global power sector indicators, targets, and rates of change required

Indicator

2018

2030 Target Range (% Change)

2050 Target Range

(% Change)

Historical Average Annual Change, 2013–18

Average Annual Change Target, 2018–30 (Range)

Average Annual Change Target, 2018–50

Acceleration Factors, 2030 / 2050

Share of renewables in electricity generation (%)

25.3%

55% to 90%

(31% to 66%)

98% to 100%

(64% to 66%)

0.7%

2.5% to 5.4%

2.3%

5.6 / 3.3

Share of unabated coal in electricity generation (%)

38.0%

0% to 3%

0%

-0.6%

-3.2% to -3.0%

-1.2%

5.1 / 2.0

Carbon intensity of electricity generation (gCO2/kWh)

531.2 gCO2/kWh (2017)

50 to 125 gCO2/kWh

(-74% to -90%)

<0 gCO2/kWh (-100%)

-9.26 gCO2/kWh

-30.1 to -36.4 gCO2/kWh

-15.2 gCO2/kWh

3.6 / 1.6

Note: Targets have upper and lower bounds for 2030 and 2050. Targets represent the highest possible ambition. Other scenarios by integrated assessment models, as well as IRENA (2020a), show ranges below 100 percent in 2050. IPCC (2018) shows the plausible range of electricity supplied by renewables at 59–97 percent in 2050 for a 1.5°C pathway.

Sources: Calculated based on IEA (2019a, 2020g); CAT (2020b).

Indicator 2: Share of unabated coal in electricity generation (%)

Target: Share of coal falls to 0–2.5 percent in 2030 and 0 percent in 2050

The falling cost of renewables and their public health benefits have led many governments to recognize that coal is becoming economically untenable and socially unfavorable (IRENA 2018a). Despite these commitments, new coal capacity1 has not sufficiently slowed in recent years; coal capacity is being added, primarily in China and India, to meet increasing demand (CoalSwarm 2020).

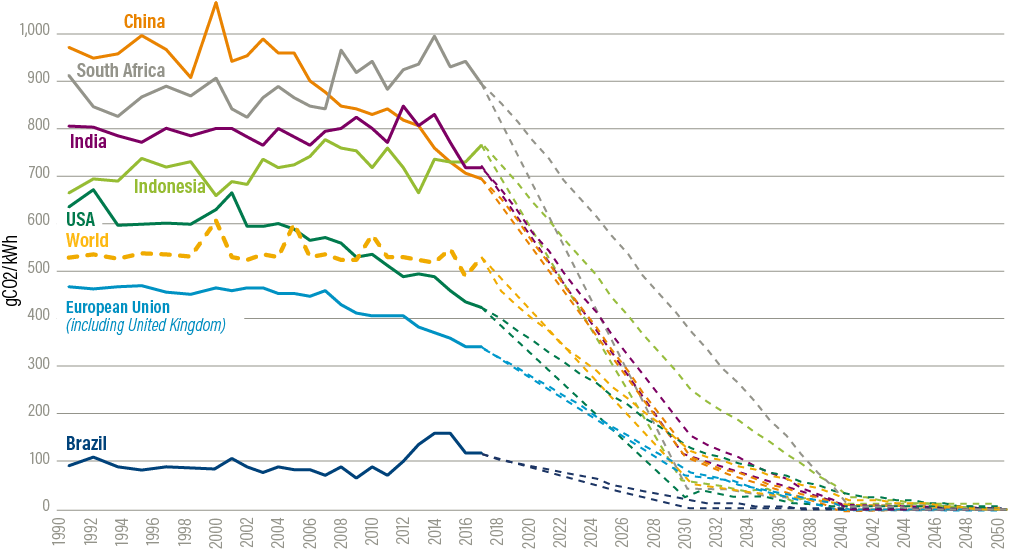
Indicator 3: Carbon intensity of electricity generation2 (gCO2/kWh)

Target: Carbon intensity falls to 50–125 gCO2/kWh in 2030 and below zero in 2050

To limit warming to 1.5°C we will need to reduce the global emissions intensity of electricity generation to below zero in 2050, but we have not seen much progress toward this target in the last 30 years. Progress to date is far from the levels required through 2030 and 2050.

The following table shows baseline data, targets for 2030 and 2050, the historical rate of change, and the needed future rates of change to meet the targets. The last column quantifies the gap between the historical and future rates of change with an acceleration factor—or how much the historical rate of change needs to accelerate to be on track to meet the targets.

Buildings

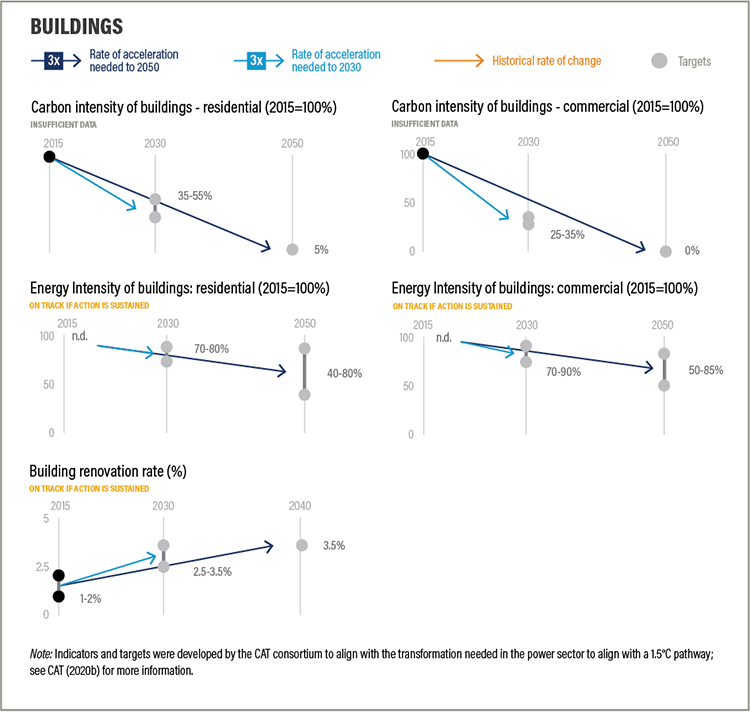
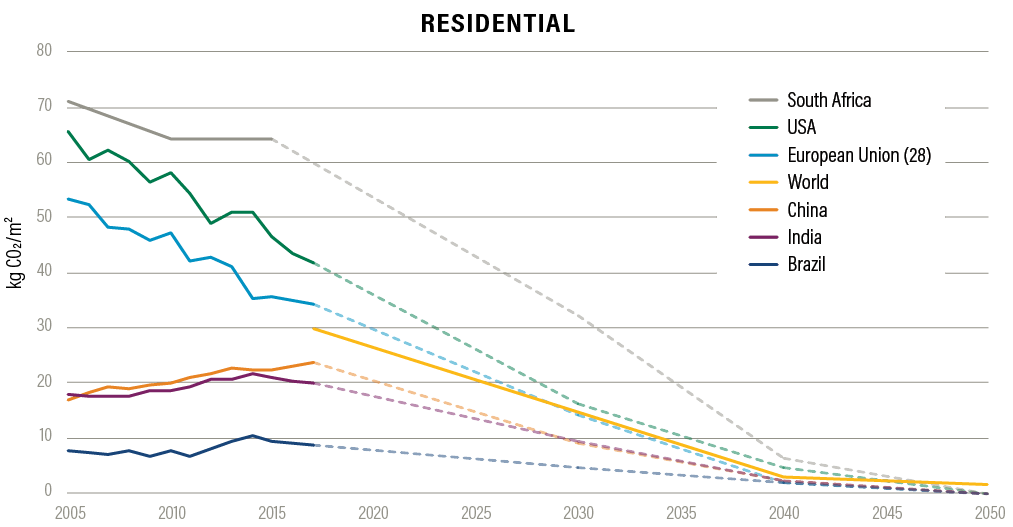
Indicator 1: Carbon intensity of buildings (kgCO2/m2)

Targets: Carbon intensity of residential buildings is 45–65 percent lower than 2015 levels by 2030 for select regions. Carbon intensity of commercial buildings is 65–75 percent lower than 2015 levels by 2030 for select regions. All buildings reach near-zero emissions intensity globally by 2050.

The carbon intensity of buildings is measured in terms of kilograms of carbon dioxide (CO2) emitted per square meter of floor area (kgCO2/m2), and covers only emissions associated with building operation. The targets for emissions intensity imply that by 2050, almost all buildings will operate at zero or near-zero emissions. Available data are insufficient to assess global progress toward the target, though recent progress in some regions is either insufficient or heading in the wrong direction (Table ES-2).

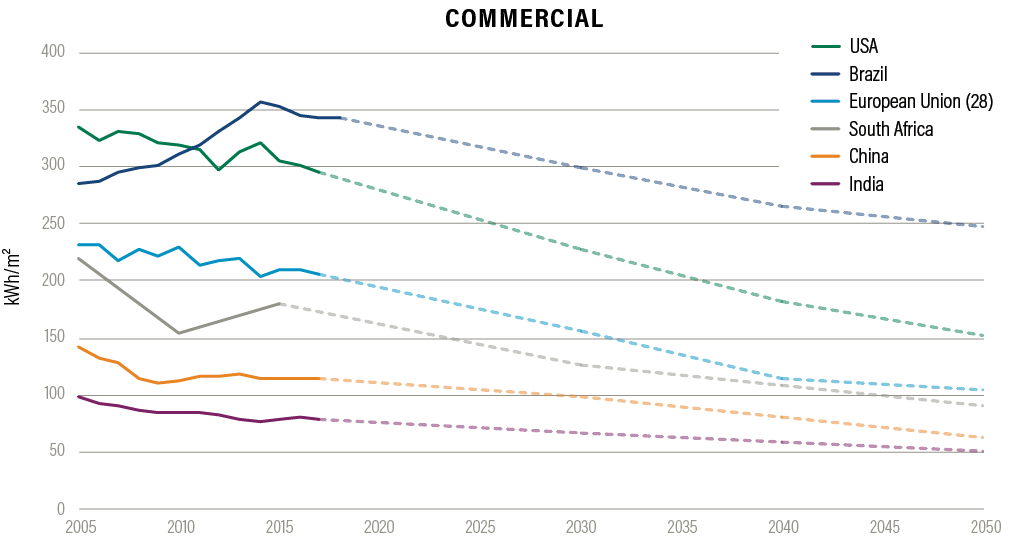
Indicator 2: Energy intensity of buildings (kWh/m2)

Targets: Energy intensity of residential buildings is 20–30 percent lower than 2015 levels by 2030. Energy intensity of commercial buildings is 10–30 percent lower than 2015 levels by 2030 in key countries and regions. Energy intensity is 20–60 percent lower for residential buildings and 15–50 percent lower for commercial buildings than 2015 levels by 2050 in key countries and regions.

Energy intensity of buildings is measured as kilowatt-hours per square meter of floor space (kWh/m2). The growth in energy intensity will be driven by regions with growing demand for energy services that improve quality of life—for example, hot regions with increased need for and access to space cooling. Efficiency gains in all energy demand activities in buildings and improvement in building envelopes will be required. The energy use per square meter must be cut almost by half in most regions in 2050 compared to 2015 levels.

Globally, the energy intensity of buildings has been decreasing by 0.5–1 percent per year since 2010, though the rate of change needs to be accelerated to at least 2.5 percent decrease per year to be on track with the sustainable development scenario (IEA 2020h). A global goal for energy intensity has not been established in this report given the significant variation in countries’ climates and national circumstances. Instead, targets are set for select countries and regions to guide potential future pathways, and the ranges of the targets are listed in Table ES-2.

Indicator 3: Renovation rate of buildings (%/yr)

Target: The share of the world’s buildings that is renovated each year rises to 2.5–3.5 percent in 2030 and 3.5 percent in 2040. No more renovation is needed in 2050.

Renovating buildings can help improve building efficiency by saving energy and reducing emissions, as well as bringing the benefit of improved well-being and comfort. Renovation here refers to deep renovation, which includes upgrades to building envelopes and shifts to zero-carbon heating and cooling technologies. The target global renovation rate would provide a Paris-compatible pathway and lead to a fully renovated building stock by 2050. Currently the world’s building stock is renovated at an average rate of around 1–2 percent per year (IEA 2020a), but the rate varies widely by region.

Industry

Table ES-2 | Buildings sector indicators, targets, and rates of change required

Indicator

2015a

2030 Target Range (% Change from 2015 Levels)

2050 Target Range (% Change from 2015 Levels)

Historical Average Annual Change, 2012–17

Average Annual Change Target, 2015–30 (Range)

Average Annual Change Target, 2015–50

(Range)

Acceleration Factors, 2030 / 2050

Residential buildings, carbon intensity (kgCO2/m²)

30b

-45% to -65%e

-95%

n.d.

-0.3 to -2.1e

-0.9

n.d. / n.d.

Commercial buildings, carbon intensity (kgCO2/m²)

61b

-65% to -75%e

-100%

n.d.

-1.8 to -6.1e

-1.8

n.d. / n.d.

Residential buildings, energy intensity (kWh/m²)

n.d.

-20% to -30%

-20 to -60%

-0.8%d

-0.9 to -3.2

-0.4 to -2.8

n.d. / n.d.

Commercial buildings, energy intensity (kWh/m²)

n.d.

-10% to -30%

-15% to -50%

-0.8%d

-0.5 to -5.1

-0.6 to -4.4

n.d. / n.d.


Historical (estimated average)

2030 target

2040c target


Renovation rate for commercial and residential buildings

1% to 2%f

2.5% to 3.5%

3.5%

n.d.f

n.d.f

n.d.f

n.d. / n.d.

Notes: n.d. indicates no data.

a The targets are defined as percentage reduction from 2015 levels. Percent reduction needed values are rounded to the closest 5 percent. While 2017 historical data are available for most countries assessed, 2015 is chosen as the base year for establishing targets in the Climate Action Tracker (CAT 2020a).

b Due to data availability, 2017 world historical data are used to calculate percentage change needed.

c Target assumes all buildings have been renovated by 2050; accordingly, no renovation target is needed in 2050.

d No global target was set in CAT (2020a) for energy intensity of buildings, so the sustainable development scenario target is included here as a reference. The world annualized percentage change is based on index (2000 = 100) data during 2014–19 available from the International Energy Agency (IEA 2020h). The rate does not differentiate between residential and commercial buildings and is used as a reference here.

e For building carbon intensity, a global target was only set for 2040 and 2050, thus 2030 ranges based on targets for select regions are shown here for the 2030 target, and average annual change needed during 2015–30.

f While limited historical value of renovation rate data are available to calculate the historical rate of change and the rate of change needed to achieve the targets, the 1–2 percent of typical current rate of energy renovation (energy intensity reduction of around 15 percent) is not sufficient for the deep renovation target set for 2030 and 2040.

Source: CAT (2020a).

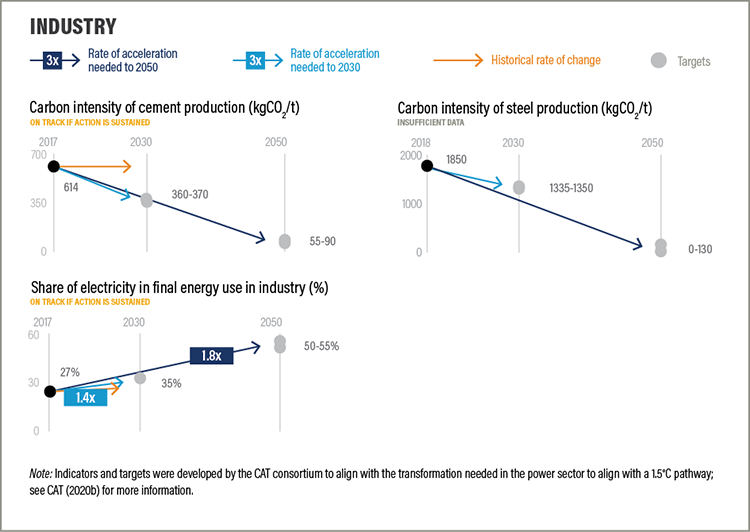
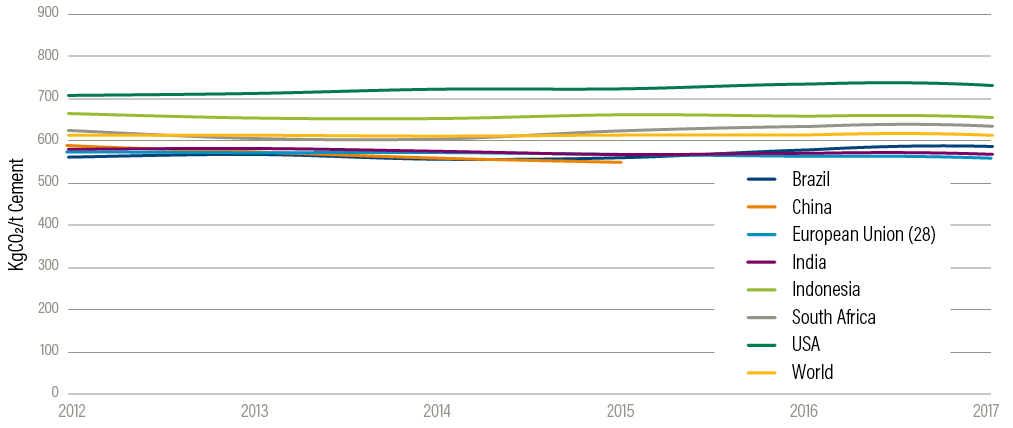
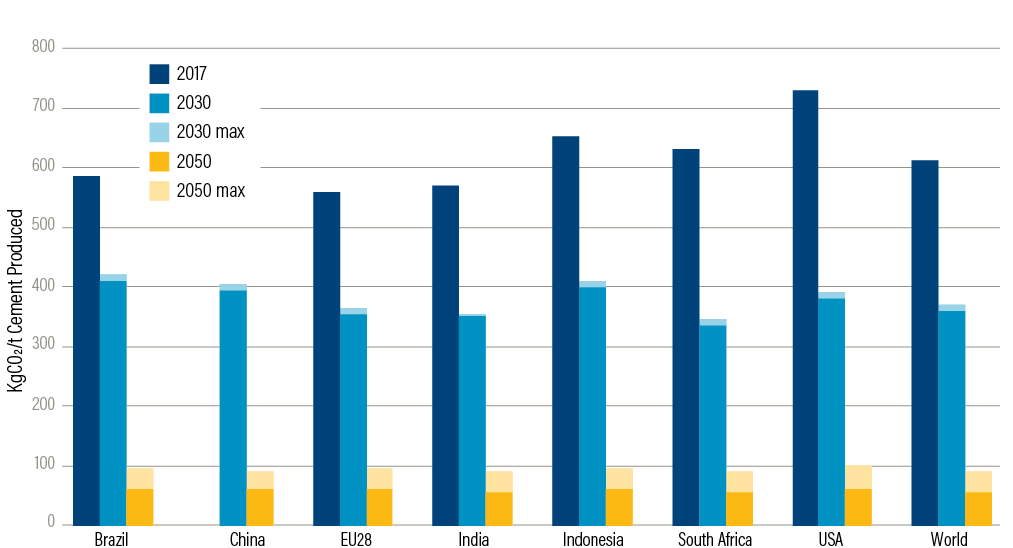
Indicator 1: Carbon intensity of cement production (kgCO2/t)

Target: Emissions intensity is 40 percent lower than 2015 levels in 2030 and 85–91 percent lower than 2015 levels in 2050, with an aspirational target to achieve 100 percent reduction in 2050.

Cement production is a carbon-intensive process and the largest contributor (27 percent) to industrial CO2emissions. Its emissions intensity has been relatively stable over the past few years, but drastic reductions will be required to decarbonize the cement production process (Table ES-3). Cement production has been relatively stable over the past five years, at around 4.1 billion to 4.2 billion tonnes per year, and is projected to continue to grow moderately (IEA 2020b).

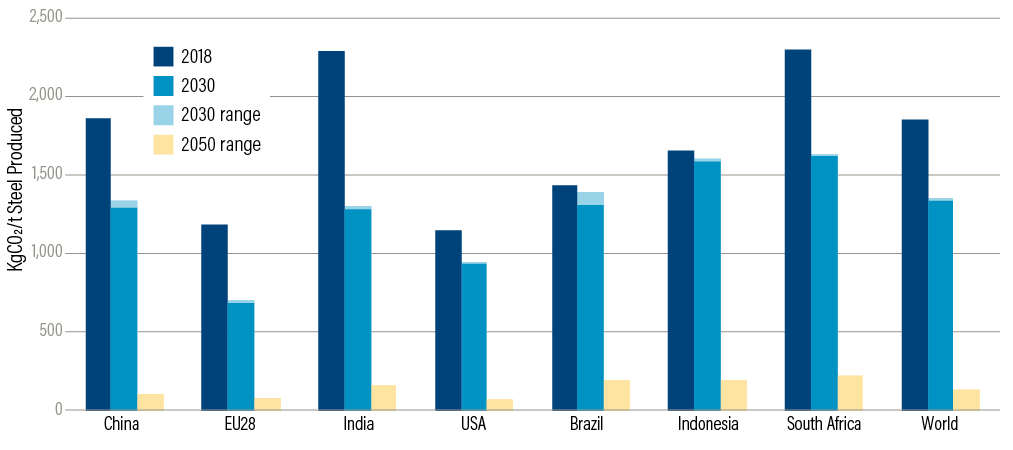
Indicator 2: Carbon intensity of steel production (kgCO2/t)

Target: Carbon intensity is 25–30 percent lower than 2015 values in 2030 and falls to near net zero in 2050.

Iron and steel production is the second-largest contributor (25 percent) to CO2emissions in the industrial sector after cement (IEA 2020e). Over the past couple of decades, the carbon intensity of steel production has been improving slightly (CAT 2020a). Global data are missing for the historical rate of change of carbon intensity in the steel sector, so it is not possible to compare it with the rate of change required in the future and assess whether we are on track to achieve the targets for this indicator.

Table ES-3 | Industry sector indicators, targets and rates of change required

Indicator

2017

2030 Target Range (% Change)

2050 Target Range (% Change)

Historical Average Annual Change, 2012–17

Average Annual Change Target, 2017–30 (Range)

Average Annual Change Target, 2017–50 (Range)

Acceleration Factors,

2030 / 2050

Carbon intensity of cement production

(kgCO2/t)

614

360 to 370

(-40% to

-41%)

55 to 90

(-85% to -91%)

0

-19 to -20

-16 to -17

n.d.c

Carbon intensity of steel production (kgCO2/t)a

1,850

1,335 to 1,350

(-27% to

-28%)

0 to 130

(-93% to

-100%)

n.d.

-42 to -43

-54 to -58

n.d.

Share of electricity in final energy use in industry (%)

27%

35%

50% to 55%

0.44%b

0.6%

0.7% to 0.8%

1.4 / 1.8

Notes: n.d. indicates no data.

a 2018 was the year of historical value for carbon intensity of steel production. It is used for calculating average annual change targets.

b 2010–17 was used to calculate historical average annual change for share of electricity in final energy use in industry due to data availability.

c Acceleration factor cannot be calculated because the baseline rate of change is zero.

Source: CAT (2020a).

Indicator 3: Share of electricity in final energy use in industry (%)

Target: The share of electricity in final energy use in industry reaches 35 percent in 2030, 45–55 percent in 2040, and 50–55 percent in 2050, compared to 27 percent in 2017.

Fossil fuels are used to provide high-temperature heat required in industrial processes like cement and steel production. Electrification of these subsectors can be increased, but it cannot fully replace fossil fuels, and alternative fuels like green hydrogen may also play a role in the future.

This indicator, however, considers not just cement and steel but all of industry. The historical electrification rate of industry is similar to the rate of change required over the next decade, but a large gap remains by midcentury. Electrification of industrial processes can only bring decarbonization benefits to the sector when powered by a low- or zero-carbon grid. Meeting the energy demand in the industry sector with low-carbon sources such as waste and sustainably produced biomass would be essential to fully decarbonize the sector.

Transport

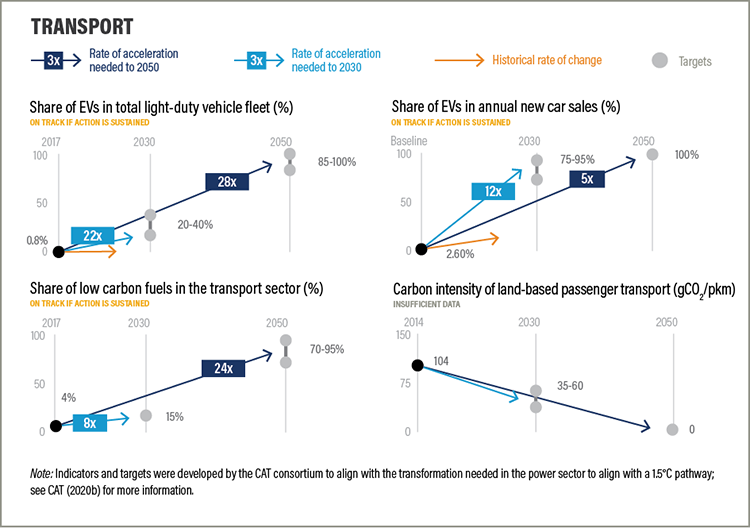
Indicator 1: Share of electric vehicles (EVs) in the global light-duty vehicle fleet

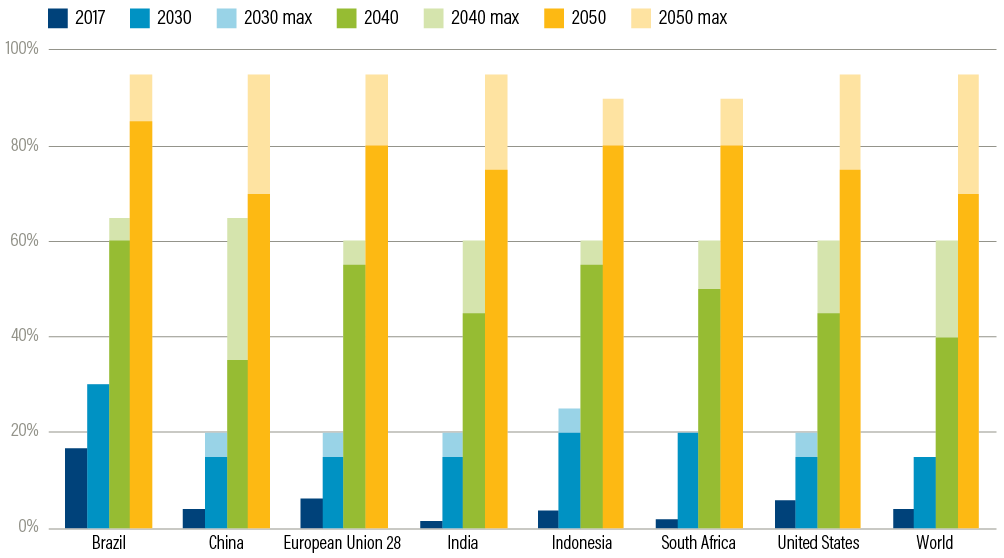
Target: Share of EVs in global light-duty vehicles reaches 20–40 percent by 2030, and 85–100 percent by 2050.

Globally, EVs are rapidly penetrating the road transport fleet. In 2010, there were about 17,000 electric cars in the world, but the stock rose to more than 7 million passenger EVs in 2019, representing almost 1 percent of the global car fleet (IEA 2020d). While promoting EVs is only part of the solution to meet the increasing travel demand with low-carbon and safe options, a rapid and accelerated transition would be required to reach the level of EV share necessary to align with the temperature goals (Table ES-4).

Indicator 2: Share of EVs in annual new car sales (%)

Target: Sale of EVs as a percentage of all new car sales reaches 45–100 percent in 2030, and 95–100 percent by 2050.

In order to decarbonize transport, all new passenger vehicles need to be zero-carbon vehicles powered by a decarbonized grid. Currently the share of EVs in new car sales is still quite small, with European countries taking the lead: EVs account for more than 1 percent of new sales in 20 countries, and Norway leads with 56 percent. The share is much lower in most other countries (IEA 2020d). Globally the share of EVs in new car sales has expanded rapidly, from 1.5 percent in 2017 to 2.6 percent in 2019 (IEA 2020d). However, this rate of increase is still not sufficient and must accelerate to reach what is needed by 2030 and 2050.

Indicator 3: Carbon intensity of land-based passenger transport (gCO2/pkm)

Target: Carbon intensity per passenger-kilometer traveled cut in half in 2030 compared to 2014 levels and reaches near zero in 2050.

Table ES-4 | Transport sector indicators, targets and rates of change required


2017

2030 Target Range (% Change)

2050 Target Range (% Change)

Historical Average Annual Change, 2010–17

Average Annual Change Target, 2017–30 (Range)

Average Annual Change Target, 2017–50 (Range)

Acceleration Factors,

2030 / 2050

EV share (%) in total vehicle stock

0.8%b

20% to 40%

85% to 100%

0.1%d

1.5% to 3.0%

2.6% to 3.0%

22 / 28

EV share (%) in new vehicle sales

2.6%c

75% to 95%

100%

0.6%c

5.7% to 7.2%

3.0%

12 / 5.2

Carbon intensity of land-based transport (gCO2/pkm)a

104

35 to 60

(-42% to

-66%)

0

(-100%)

n.d.

-2.8 to -4.3

-2.9

n.d.

Share of low-carbon fuels in transport sector (%)

4%

15%

70% to 95%

0.10%

0.8%

2.0% to 2.8%

8 / 24

Notes: n.d. indicates no data.

a Historical value and calculations of percentage change needed are based on 2014 data for carbon intensity of land-based transport.

b 2019 numbers based on IEA (2020d) as a proxy for historical level. Historical rate of change is during 2014–19. Both battery electric vehicles (BEVs) and plug-in hybrid electric vehicles (PHEVs) are covered here.

c 2019 numbers based on IEA (2020d) as a proxy for historical level and rate of change. Both BEVs and PHEVs are covered in the share. Historical rate of change is during 2017–19 based on available data.

Source: CAT (2020a).

A key opportunity to decarbonize the transport sector lies in reducing the fossil fuel combusted in vehicles and switching to electricity or low-carbon fuel types. It is also important to incentivize behavioral changes such as choosing to use more public transport and car-sharing rather than private vehicles. There are no historical data for this indicator, and accordingly the pace of historical change cannot be compared with what is needed by 2030 and 2050.

Indicator 4: Share of low-carbon fuels in the transport sector (%)

Target: Share of low-carbon fuels reaches 15 percent by 2030 and 70–95 percent by 2050.

Currently the transport sector is still largely dependent on fossil fuels. While we have seen improvement in the share of low-emissions fuels in transport over the past two decades, the rate of change needs to about double in the next decade and increase multifold by midcentury. The modeling does not prescribe the specific low-carbon fuels to be used in each country, although options can include, among others, electricity powered by a decarbonized grid, sustainably produced biomass, and hydrogen.

Forests

Indicator 1: Deforestation (million hectares)

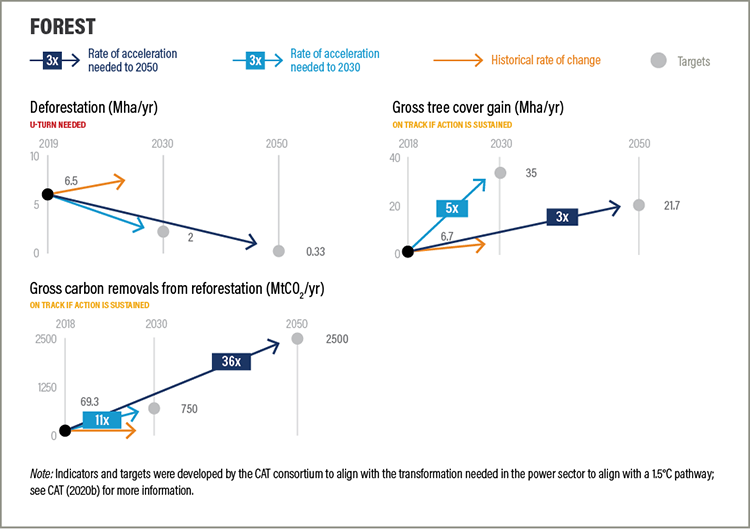
Target: Reduce deforestation by 70 percent relative to the 2019 level by 2030 and by 95 percent by 2050.

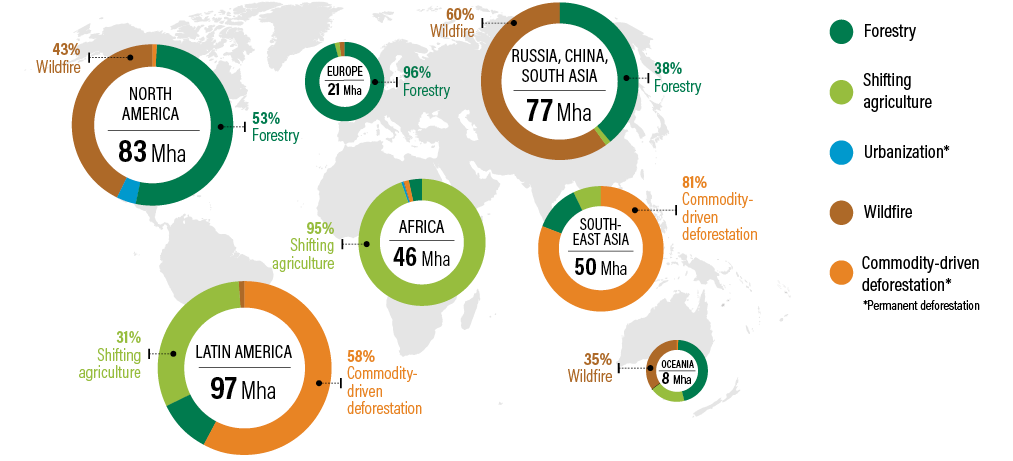
Forest losses caused by conversion to other land uses, such as commodity production, urbanization, and in some cases shifting agriculture, are most likely to be permanent (i.e., deforestation). To be on track to keep temperature rise below 1.5°C, it is critical to reduce total deforestation 70 percent by 2030 and 95 percent by 2050 (Roe et al. 2019) (Table ES-5). In 2014, a broad coalition of national governments and other organizations adopted the New York Declaration on Forests—one of many initiatives aimed at reducing deforestation—with a goal of halving deforestation by 2020 and eliminating it by 2030. Since then, tree cover loss has not declined but rather has increased (NYDF Assessment Partners 2019).

Indicator 2: Gross tree cover gain (million hectares)

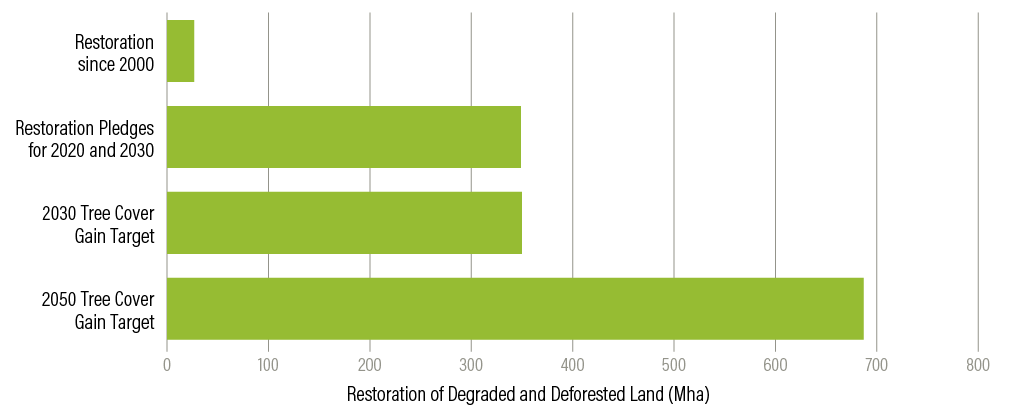
Target: Restore tree cover on 350 million hectares of land by 2030 and 678 million hectares by 2050.

Political will for reforestation is high, but translating commitments to action has proved more difficult for a number of reasons, including competition for land for food production and limited capacity to collect data and report progress. There are no globally consistent data for reforestation specifically, but some data are available for landscape restoration, which includes reforestation and is the best proxy measure available. Countries have pledged to restore 349 million hectares (Mha) of land by 2030 under the Bonn Challenge3 and in nationally determined contributions (Cook-Patton forthcoming). Since 2000, however, only 26.7 Mha have actually been restored based on available data, which are not yet comprehensive (Bonn Challenge 2020; NYDF Assessment Partners 2019).

Table ES-5 | Forest sector indicators, targets, and rates of change required

Indicator

Baseline Data

2030 Target

2050 Target

Historical Average Annual Change, 2015–19

Average Annual Change Target, 2019–30

Average Annual Change Target, 2019–50

Acceleration Factors,

2030 / 2050

Deforestation (Mha/yr)

6.5

(2019)

2.0

0.33

0.12

-0.42

-0.2

n.a.; U-turn

Gross tree cover gain

6.7 Mha/yr

(2000–2012 avg)a

350 Mha cumulative

678 Mha cumulative

6.7 Mha/yr

35 Mha/yr

21.7 Mha/yr

5.2 / 3.2

Carbon removal from tree cover gain

69.3 MtCO2/yr

(2000–2012 avg)a

7,500 MtCO2

cumulative

75,000 MtCO2cumulative

69.3 MtCO2

750 MtCO2/yr

2,500 MtCO2/yr

11 / 36

Notes:

a Data are only available as a total tree cover gain amount for 2000–2012, so we do not have two distinct data points to establish a historical rate of change; however, even the fastest rate of change possible would still be below what is needed, so both indicators are marked in yellow.

Sources: GFW (2020); Roe et al. (2019); Griscom et al. (2017).

Indicator 3: Carbon removal from the atmosphere due to tree cover gain (MtCO2)

Target: Cumulative carbon removal to reach 7.5 gigatonnes of carbon dioxide (GtCO2) by 2030 and 75 GtCO2 by 2050 above the 2018 level.

Carbon sequestration by trees will need to increase: it is estimated that by 2030, 7.5 GtCO2cumulative total will need to be sequestered, and by 2050 a cumulative 75 GtCO2will need to be sequestered (Roe et al. 2019). While difficult to measure, current estimated current carbon removal from tree cover gain is far below levels required to reach these targets (Roe et al. 2019; Griscom et al. 2017).

Agriculture

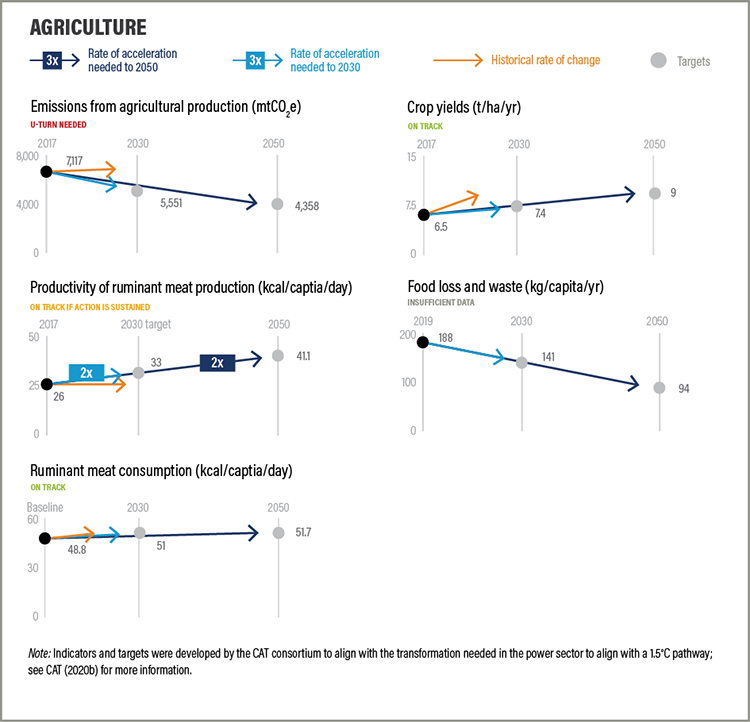
Indicator 1: Emissions from agricultural production (excluding land use change) (MtCO2e)

Target: 2030: 22 percent reduction from the 2017 level; 2050: 39 percent reduction from the 2017 level.

Global agricultural production emissions (mainly emissions from livestock production, agricultural energy use, rice cultivation, and soil fertilization) grew by 3 percent between 2012 and 2017 (FAO 2020). Under a business-as-usual scenario, global agricultural production emissions are projected to grow by 27 percent between 2017 and 2050 (Searchinger et al. 2019). However, to keep temperature rise to 1.5˚C, emissions would need to move in the other direction, falling by 39 percent during that time to near 4 GtCO2e/yr (Searchinger et al. 2019), and these remaining agricultural production emissions would need to be offset by large-scale reforestation (Forests Indicator 2) to achieve a “net-zero” land sector by midcentury.4 To this end, Indicators 2–5 track progress in implementation of strategies that would reduce agricultural land demand relative to business-as-usual and provide planetary space for avoided deforestation and reforestation (Table ES-6).

Indicator 2: Crop yields (t/ha/yr)

Target: 2030: 13 percent increase from the 2017 level; 2050: 38 percent increase from the 2017 level.

In order to feed 10 billion people by 2050, crop yields must increase even faster over the next 30 years than over the past 60 in order to increase crop production on existing agricultural land and avoid additional expansion into natural areas. Increasing productivity is critical to simultaneously meeting food production and environmental goals. Improving crop breeding, improving soil and water management, and planting existing cropland more frequently can all contribute to increased yields in a changing climate. Global crop yields grew by 0.11 tonnes per hectare per year (t/ha/yr) between 2012 and 2017, or slightly above the rate of change needed between 2017 and 2050. While this is encouraging, two caveats are necessary. First, this global yield growth represents an enormous amount of effort, and just maintaining the necessary level of improvement for another three decades, in a changing climate, will be a major undertaking. Second, this recent global trend masks wide variation between regions. In particular, sub-Saharan Africa, where crop yields are the lowest in the world, saw slow yield growth from 2012 to 2017 (only 0.01 t/ha/yr), when compared to the regional target of 0.11 t/ha/yr between 2017 and 2050 to meet projected growth in regional food demand without further deforestation and/or increasing reliance on food imports.

Indicator 3: Productivity of ruminant meat production (kg/ha/yr)

Target: 2030: increase of 27 percent above the 2017 level; 2050: increase of 58 percent above the 2017 level.

As incomes rise, demand for meat and milk from ruminant animals (e.g., cattle, sheep, goats) is likely to grow even more than demand for crops out to the year 2050. At a global scale, the pace of productivity gains between 2017 and 2050 would need to be even faster than between 2012 and 2017, a period that saw a 5 percent increase in ruminant meat production per hectare of pasture per year (FAO 2020).

Table ES-6 | Agriculture sector indicators, targets, and rates of change required

INDICATOR

BASELINE DATA 2017

2030 Target (% Change)

2050 Target (% Change)

AVERAGE Annual Change, 2012–17

Average Annual Change Target, 2017–30

Average Annual Change Target, 2017–50

Acceleration Factors, 2030 / 2050

Emissions from agricultural production (MtCO2e)

7,117

5,551 (-22%)

4,358 (-39%)

36.9

-120.5

-83.6

n.a.; U-turn

Crop yields (t/ha/yr)

6.5

7.4 (13%)

9.0 (38%)

0.11

0.07

0.08

On track

Productivity of ruminant meat production (kg/ha/yr)

26.0

33.0 (27%)

41.1 (58%)

0.24

0.54

0.46

2.3 / 1.9

Food loss and waste (kg/capita/yr)

188a

141 (-25%)

94 (-50%)

n.d.

n.d.

n.d.

n.d.

Ruminant meat consumption (kcal meat/capita/day)

48.8

51.0 (5%)

51.7 (6%)

-0.3

0.2

0.1

On track

Note:

a Estimate is for year 2009, given in FAO (2011a). More current global estimates are not yet available.

Sources: FAO (2020) for years 2012 and 2017; GlobAgri-WRR model in Searchinger et al. (2019) for 2030 and 2050 targets.

Indicator 4: Food loss and waste (kg/capita/yr)

Target: 2030: 25 percent reduction below the 2017 level; 2050: 50 percent reduction from the 2017 level.

Roughly one-third of all food produced in the world each year (by weight) is lost or wasted between the farm and the fork (FAO 2011a). Because of the many complexities across regions and supply chains and gaps in food loss and waste data, we have set equal targets of 25 percent reductions in per capita food loss and waste across all regions by 2030 and 50 percent by 2050.

Indicator 5: Ruminant meat consumption (kcal/person/day)

Target: 2030: limit increase to 5 percent above the 2017 level; 2050: limit increase to 6 percent above the 2017 level.

As incomes rise and people move to cities, diets tend to become more varied and also higher in resource-intensive foods like meat and dairy. For this reason, consumption of animal-based foods is projected to grow by nearly 70 percent between 2010 and 2050 (Searchinger et al. 2019). Modest increases in consumption of animal-based foods can boost nutrition in low-income countries, but in countries where meat consumption is high, shifting diets toward plant-based foods can reduce agricultural land demand and GHG emissions. If ruminant meat consumption in high-consuming countries declined by 40 percent by 2050 to 52 kcal/person/day, or about 1.5 burgers/person/week, it would reduce agricultural land demand by more than 500 million hectares relative to business-as-usual (Searchinger et al. 2019). Per capita ruminant meat consumption declined at the global level between 2012 and 2017, but this global trend hides regional variation. The trend from 2012 to 2017 shows that the Americas and Europe would need to reduce consumption three times more quickly to meet 2050 regional targets. Meanwhile, low-income regions such as sub-Saharan Africa actually reduced ruminant meat consumption between 2012 and 2017, even though their 2050 regional target allows for growth. Therefore, the world saw recent progress toward the global target but in a suboptimal way that maintained inequality of consumption between regions.

Start reading