Foreword
boudhayan bardhan/Unsplash
For at least two decades, countries, companies, cities, and communities have been claiming they are “doing better” on climate change. Annual reports have been full of ratios showing greenhouse emissions per unit of output falling, and sometimes emissions falling in absolute terms. All good—but unfortunately, rarely enough. All over the world, as leaders and CEOs have been honestly claiming they are doing better, the situation has been getting worse.
We now know that the situation is indeed much worse than we had earlier understood. The world’s leaders now recognize that to protect future prosperity and well-being we must limit global warming to an average of 1.5 degrees Celsius. This requires not incremental change, but radical change—roughly a halving of carbon emissions each decade through 2050. All sectors must play a part in this massive and exciting transition. But which sectors are doing their part? And which are falling short?
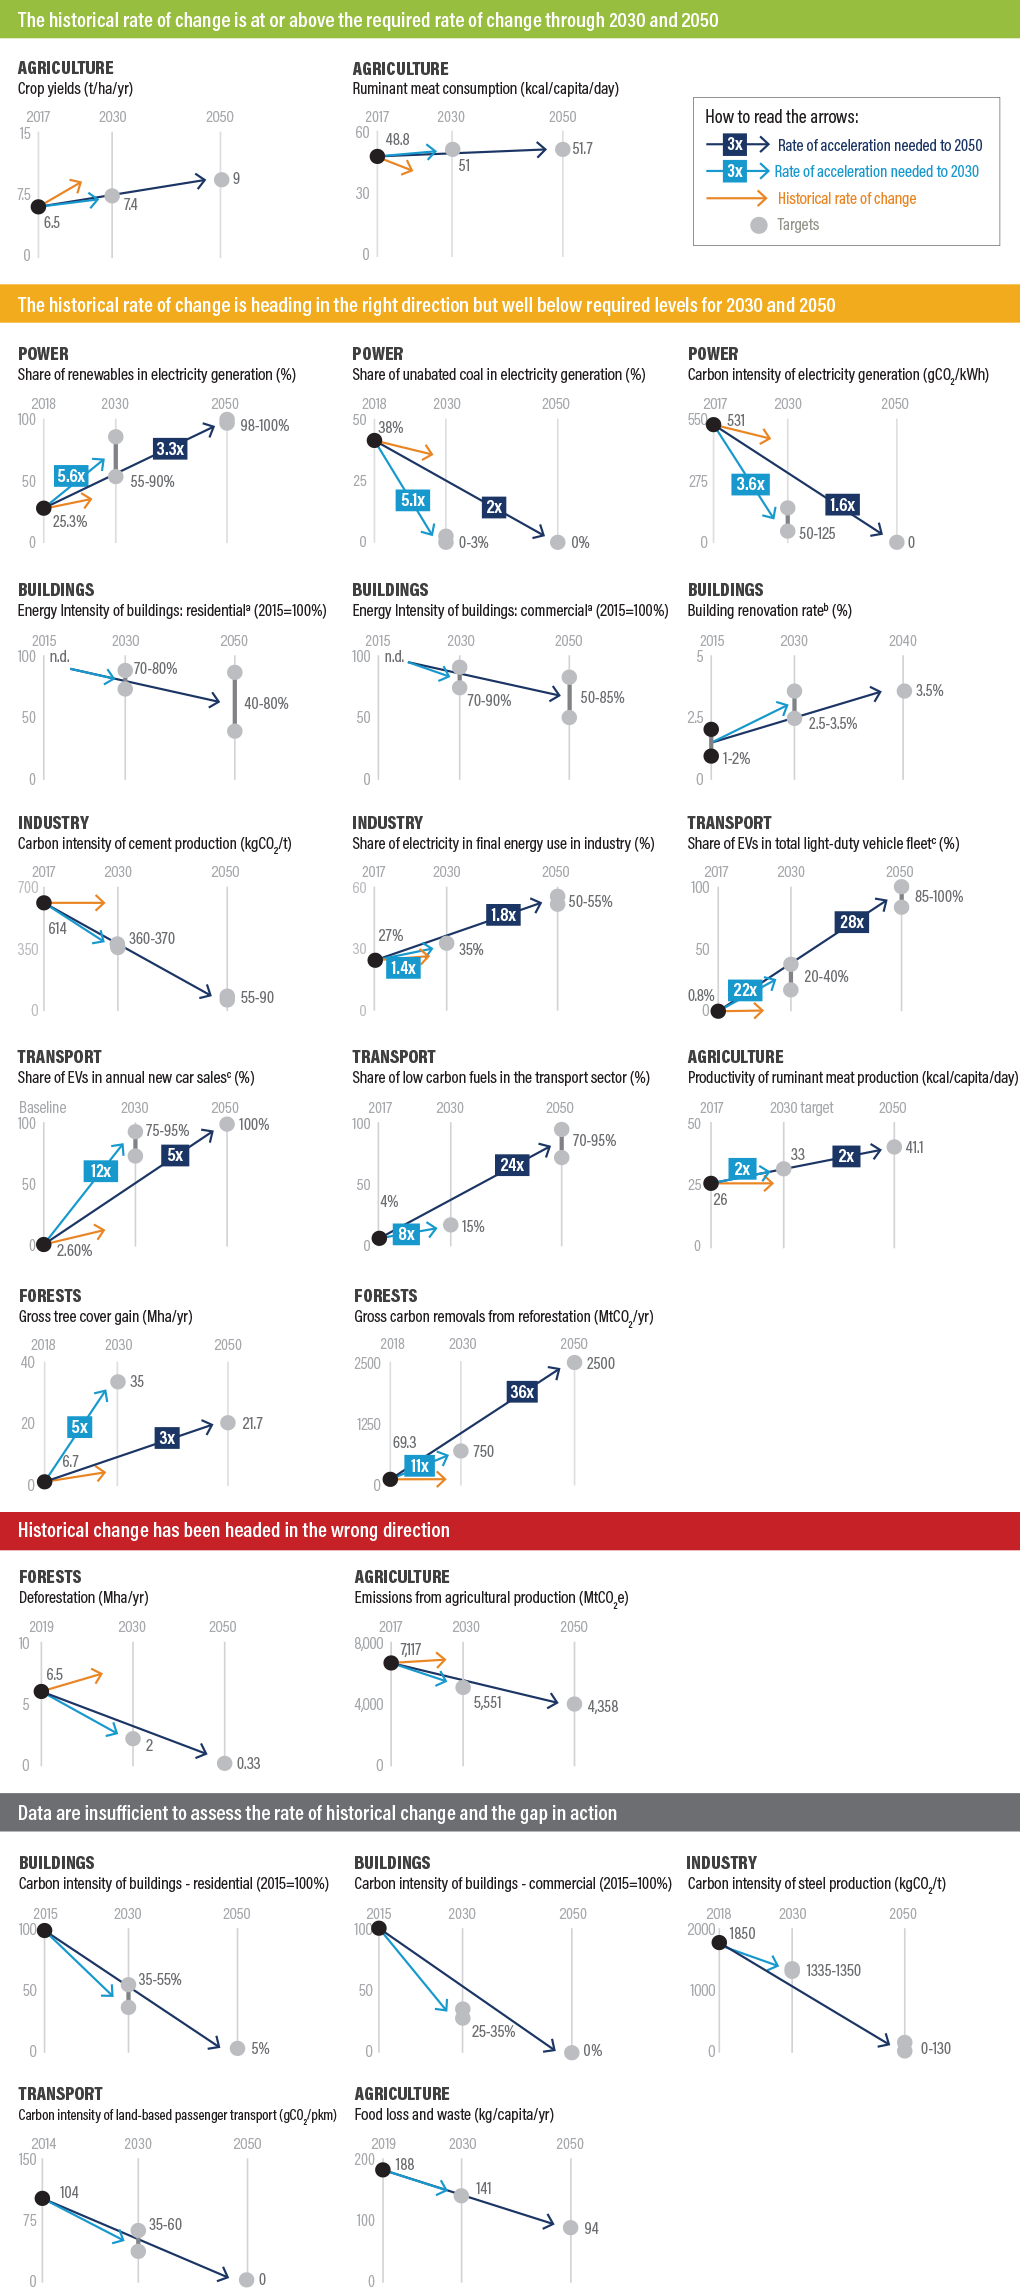
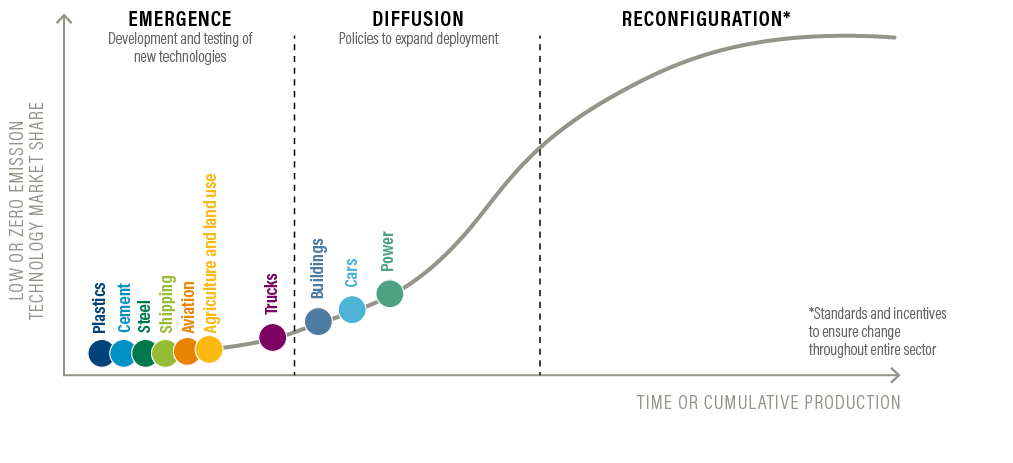
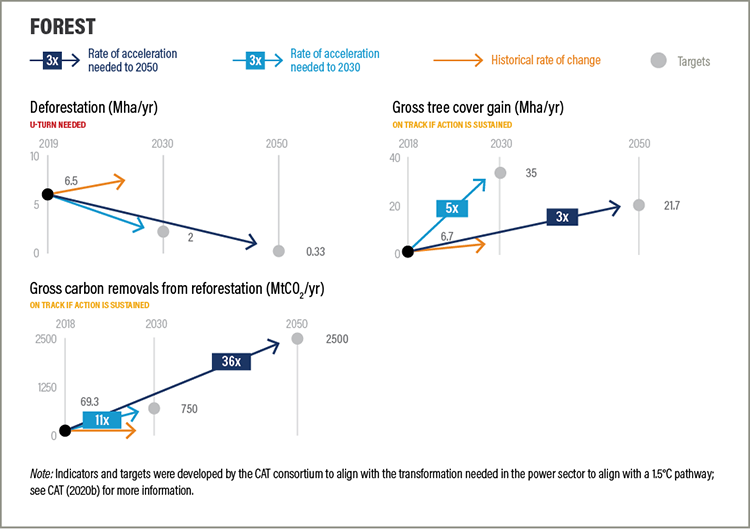
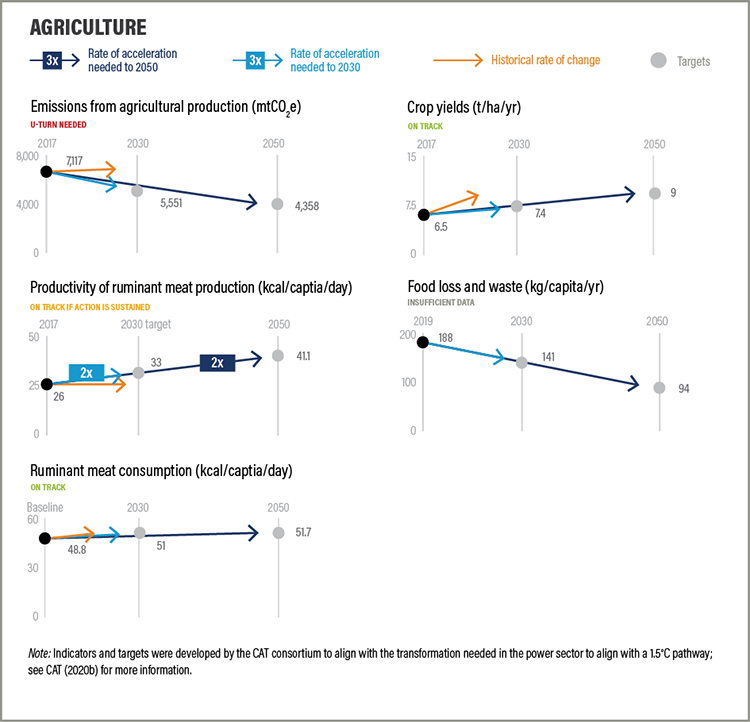
In this State of Climate Action report, the World Resources Institute and ClimateWorks Foundation ask how we are doing on this journey. It explores global and country-level progress across six key sectors—using 21 benchmark indicators developed by the Climate Action Tracker and WRI. In most cases progress is being made, but in only 2 cases out of 21 is the pace of progress enough. Sadly, in 2 cases we are headed in the wrong direction altogether, and in 4 cases there is simply not enough data to say where things stand.
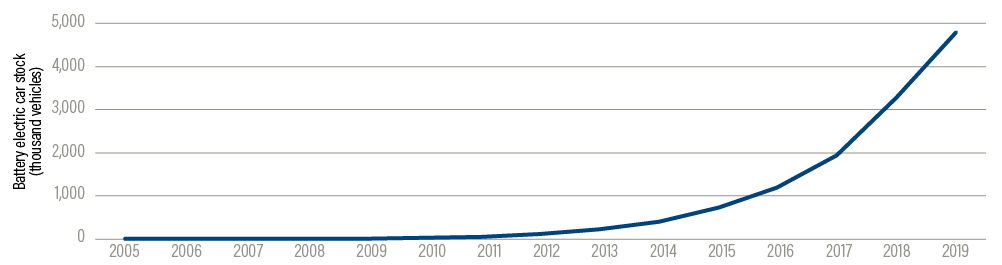
To get on track, the world must—among other actions—rapidly transition to clean electricity generation, accelerate the uptake of electric vehicles, reduce emissions from industrial production, boost agricultural productivity, shift to more sustainable food consumption patterns, and increase annual tree cover gain. For these and other goals, the report specifies the much faster rate of progress needed to meet most of these global targets.
None of these transitions is easy. They require not incremental change, but systems change that no individual actor can deliver. They require multistakeholder engagement of governments, corporations, citizens, financial institutions, philanthropy, and the scientific community. The good news is that in all these transformations, there is a path forward that makes good sense economically, socially, and politically, as well as environmentally.
The report shows that these transitions are essential for developing and developed countries, but that developing countries will require significant financial investments, technology transfer, and capacity building to drive climate action. History has shown that transformative change can happen at an exponential, nonlinear rate; just look at how quickly cars, phones, and connected computers revolutionized our world. With the right support, low-emissions technologies such as electric vehicles, renewable energy, and low-carbon steel could be next.
By revealing how goes the battle, this report shows us the path to victory: a zero-emissions world in which all people can thrive.
Andrew Steer
President & CEO
World Resources Institute
Charlotte Pera
President & CEO
ClimateWorks Foundation