State of Climate Action

Assessing Progress toward 2030 and 2050

Partners:

Methodology, Assumptions, and Limitations for Assessing Progress by Sector

The science indicates what is required globally to limit warming to safe levels, but stocktaking is necessary to inform investments and policymaking. This study presents a set of sector indicators with global and national targets to measure progress toward limiting emissions to a level aligned with the Paris Agreement’s goals. It reviews trends in recent years and assesses progress toward—or away from—the targets established for 2030 and 2050. We have chosen to assess 2030 and 2050 to inform near-term action, especially in the context of NDC updates, which are invited this year, and indicate the longer-term transformation that is required.

Matthew Henry/Unsplash

Choice of Indicators

The report assesses progress toward global and national targets in power, buildings, industry, transport, forests, and agriculture for 2030 and 2050. For each sector, several indicators were identified that the literature suggests are the best way to monitor sectoral decarbonization pathways. However, the indicator selection is not comprehensive due to practical constraints, and there are some omissions, such as indicators to measure performance of aviation and maritime transport. Also, the targets are not completely independent, since progress on one indicator could further another; for example, penetration of renewables on the electric grid would assist progress in decarbonizing industrial processes. Additionally, internal assumptions are consistent across sectors; for example, the indicator related to low-carbon transport fuels assumes the rate of decarbonization in the power sector that that target implies. There are different options for achieving some of the indicators, such as for reducing steel emissions intensity, whether this is achieved through a scrap route or a hydrogen route.

Design of Targets

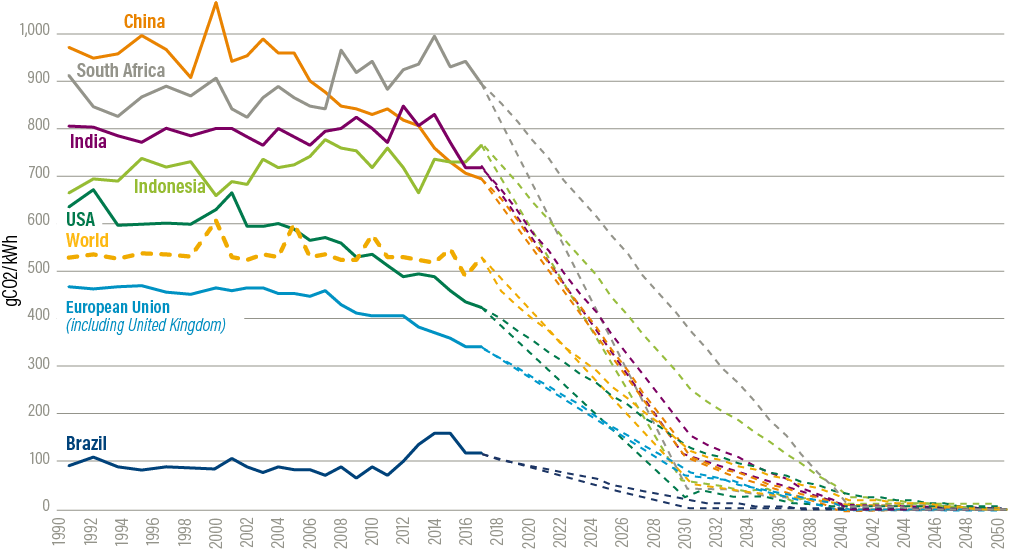
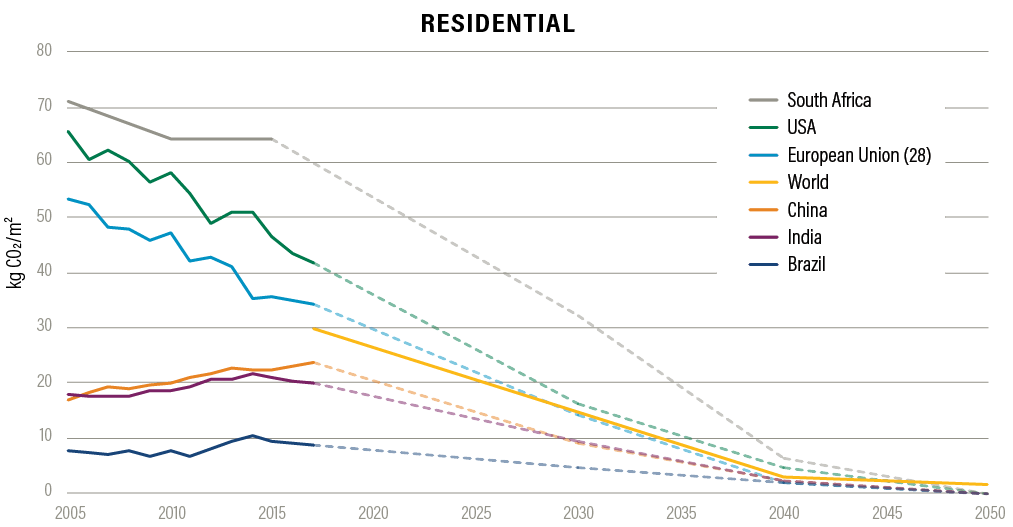
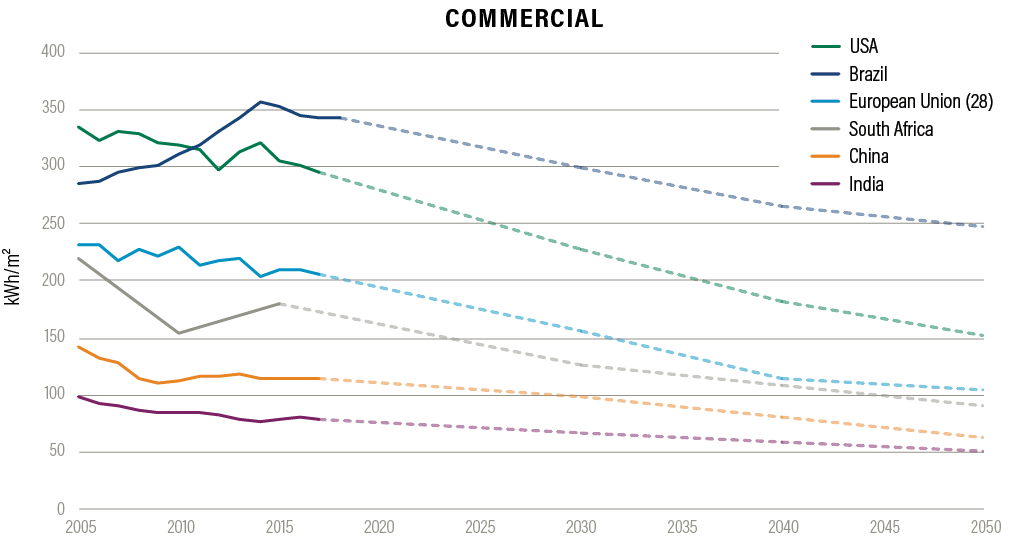
The targets for power, buildings, industry, and transport were developed by the Climate Action Tracker (CAT) consortium to be compatible with limiting warming to 1.5°C.9 They were designed to represent the highest plausible ambition while taking technology and infrastructure into account, and to increase our chances of meeting the Paris Agreement’s long-term temperature goals.

The CAT team used both top-down and bottom-up methods to establish the targets (CAT 2020a):

  • Integrated assessment models (IAMs): The CAT team first considered the IAMs that were able to limit warming to 1.5°C (“no overshoot” and “low overshoot” scenarios in which a brief and limited overshoot of average warming occurred). The team then refined their selection to include only those scenarios that assumed sustainable use of carbon removal (bioenergy combined with carbon capture and storage, reforestation and afforestation). These pathways are defined on a least-cost pathway and do not take into account equitable distribution of costs and required action.
  • Downscaled IAMs: In addition to the global scenarios from the IAMs, the CAT team used a simplified IAM10 to downscale regional IAM pathways to the country level. These modeled pathways on the country level account for the initial energy mix of the countries and the regional transition. The downscaling is done for 1.5°C-compatible pathways that are harmonized to country-specific historical data.
  • Bottom-up sectoral modeling and studies at the national level: The CAT team also used a combination of its own bottom-up modeling (e.g., steel, EVs, cement, buildings) and other independent literature. For these studies, technical feasibility, rather than a full economic analysis, and the countries’ current status for a given indicator were taken into account for the country-specific targets. Each sectoral target that was derived from such bottom-up analyses was still compared with 1.5°C-compatible IAMs to ensure that, if there was any discrepancy, the bottom-up approaches were more ambitious in achieving decarbonization more rapidly.

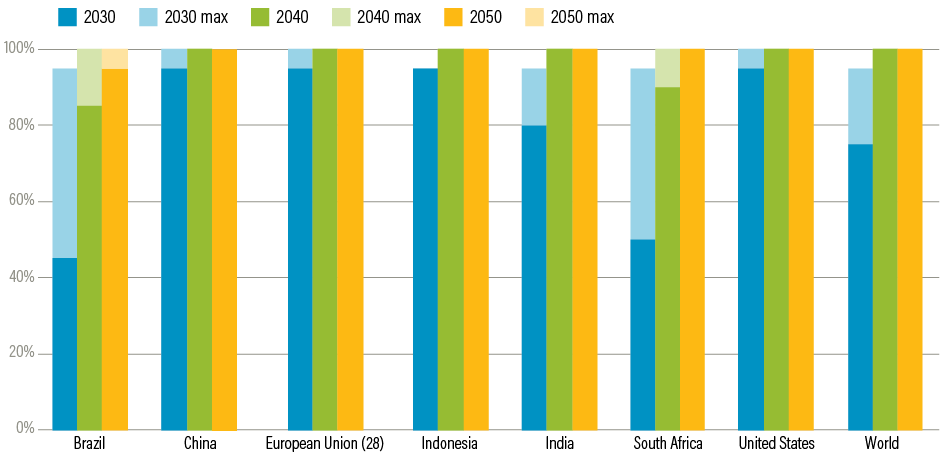
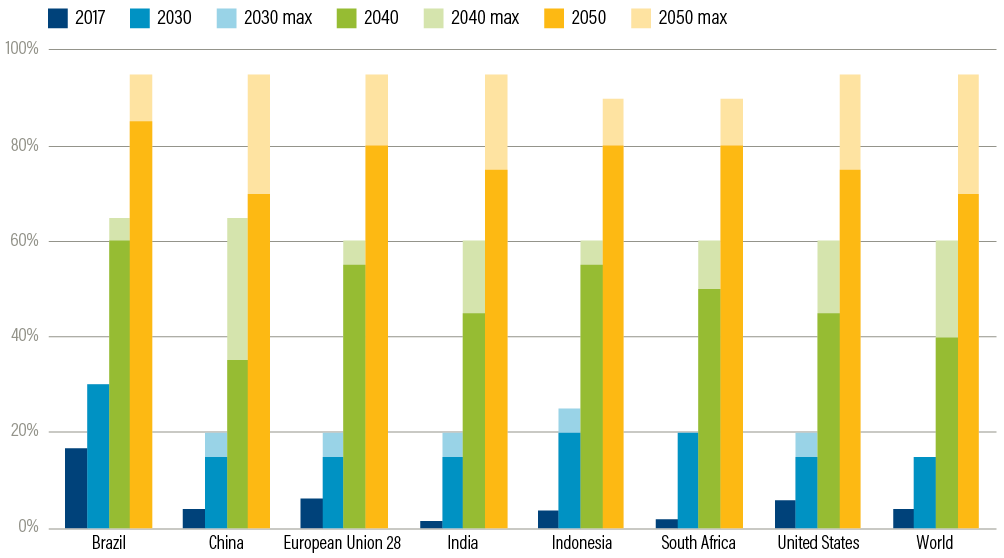
When targets are presented as a range of values, the lower end of the range represents what can be achieved with current technologies and strategies. The more ambitious end of the range relies on technologies and strategies that are known but have not been developed and deployed at scale, or in some cases represent trade-offs in decarbonization with other sectors (CAT 2020a). For more information on the design of targets, see CAT (2020b).

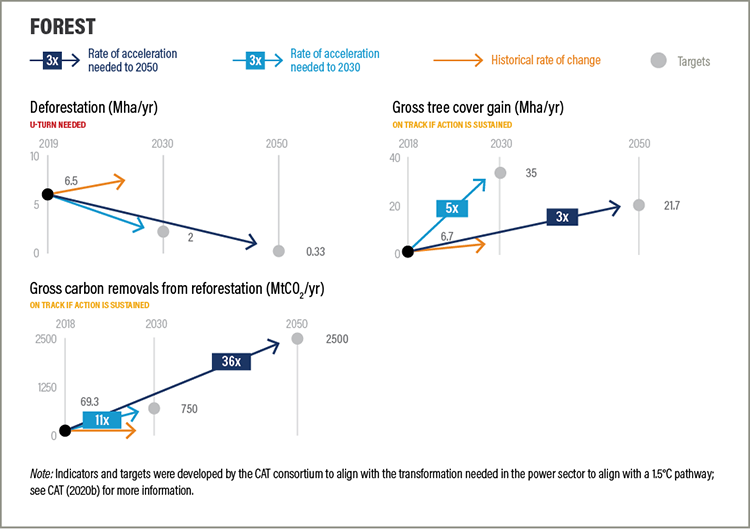
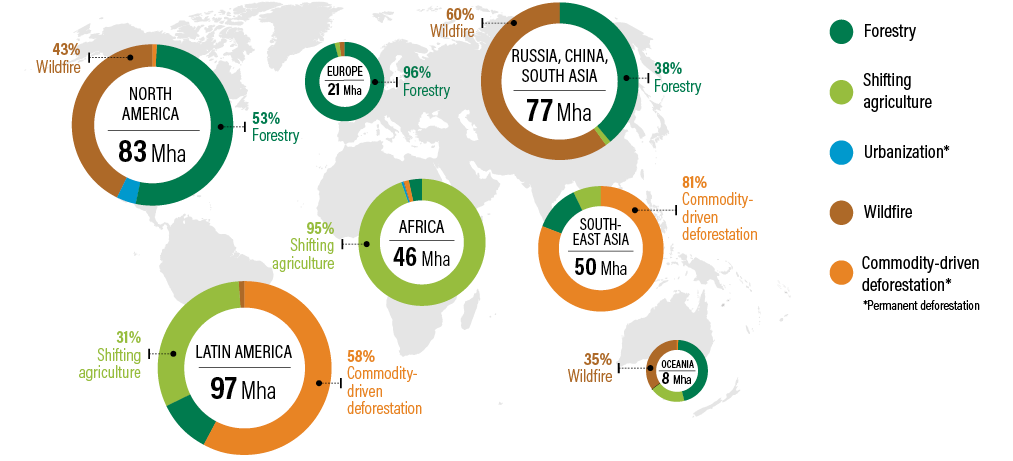
The forests and agriculture targets were developed by WRI. Forest indicators and targets for 2030 and 2050 are based on what the literature suggests is needed in terms of reduced deforestation and increased reforestation to be in line with 1.5°C temperature rise. National targets are determined through burden-sharing of global targets based on area of reforestation potential. Agriculture targets were set using a model from Searchinger et al. (2019). Determining criteria for these targets were food security for 10 billion people, nearly 600 million hectares of reforestation, and no more than 4 GtCO2e/yr of agricultural production emissions. The regional- and country-level 2050 targets for Indicators 1–3 and 5 in this section are also outputs of the model. Additional details are provided in Box 1. Indicator 4’s targets are based on Sustainable Development Goal 12.3 on food loss and waste reduction.

It should be noted that the indicators chosen in this report represent a set of critical actions but are not comprehensive.

Country Selection and Consideration of Equity

Targets were chosen at the global level, as well as for China, the United States, India, the European Union (EU28),11 Indonesia, Brazil (six of the top seven emitters, excluding Russia), and South Africa (as the highest emitter in Africa). For the forests sector, we also include Bolivia, Colombia, the Democratic Republic of the Congo, and Malaysia, because these countries have among the highest levels of deforestation and related emissions.

The targets for power, buildings, industry, and transport take into account the current status of an indicator in a given country, thereby recognizing current practice and differing national capacities to more readily bring about change. However, given the very small remaining carbon budget consistent with limiting warming to 1.5°C, very rapid and deep reductions are required across all major emitting countries and sectors. Accordingly, at least for major emitters, there is little room for staggered decarbonization, which allows some countries to reduce emissions more slowly given historical responsibility for emissions or current capabilities. And to the extent developing countries have a slower decarbonization pathway in the near term, this implies faster progress from developed countries. This means that, while the developed countries included in this study have targets as or more stringent than other countries, there is often convergence among national targets, especially toward midcentury. It will be essential that countries without the domestic capacity or financial resources to decarbonize sufficiently to reach their targets be supported by higher-income countries (CAT 2020a). Targets for the forests sector are based largely on the relative availability of land area for reforestation, and agriculture targets are based on socioeconomic and technology developments (see sections for more detail). For all sectors, higher-income countries will need to support other countries’ decarbonization pathways and help them leapfrog antiquated carbon-intensive technologies, for example, through finance, technology transfer, and other support. Future research should assess the required finance, technology-transfer, and capacity-building needs associated with supporting such transformations.

Limitations

While the scale of change described in this report is technically feasible, this report does not assess feasibility from a policy, regulatory, or societal standpoint. In many countries, significant barriers stand in the way of advancing change on this order of magnitude, and these hurdles must be overcome if we are to realize the targets described below. Furthermore, if these targets are to be successfully achieved, these transformations must be pursued in a just manner, and with care, building support over time to ensure durability and legitimacy.

Assessment of Progress toward Our Targets

In order to show a snapshot of progress, we start by collecting historical data. In some cases, no data, or limited data, exist to show how the current level of effort measures up against a particular target, and this has been noted accordingly. The historical datasets we chose were those that are open, independent of bias, reliable, consistent, and cover the greatest number of countries included in our analysis.

There is often a time lag before data become available (for most indicators assessed here between one and three years, but a handful lag between five and nine years), and the year of most recent data varies among indicators. There is another lag between implementation of climate action and its impacts. Accordingly current data may not capture change in the so-called real economy that is occurring in some countries and globally, which may lead to measurable change in indicators only several years later.

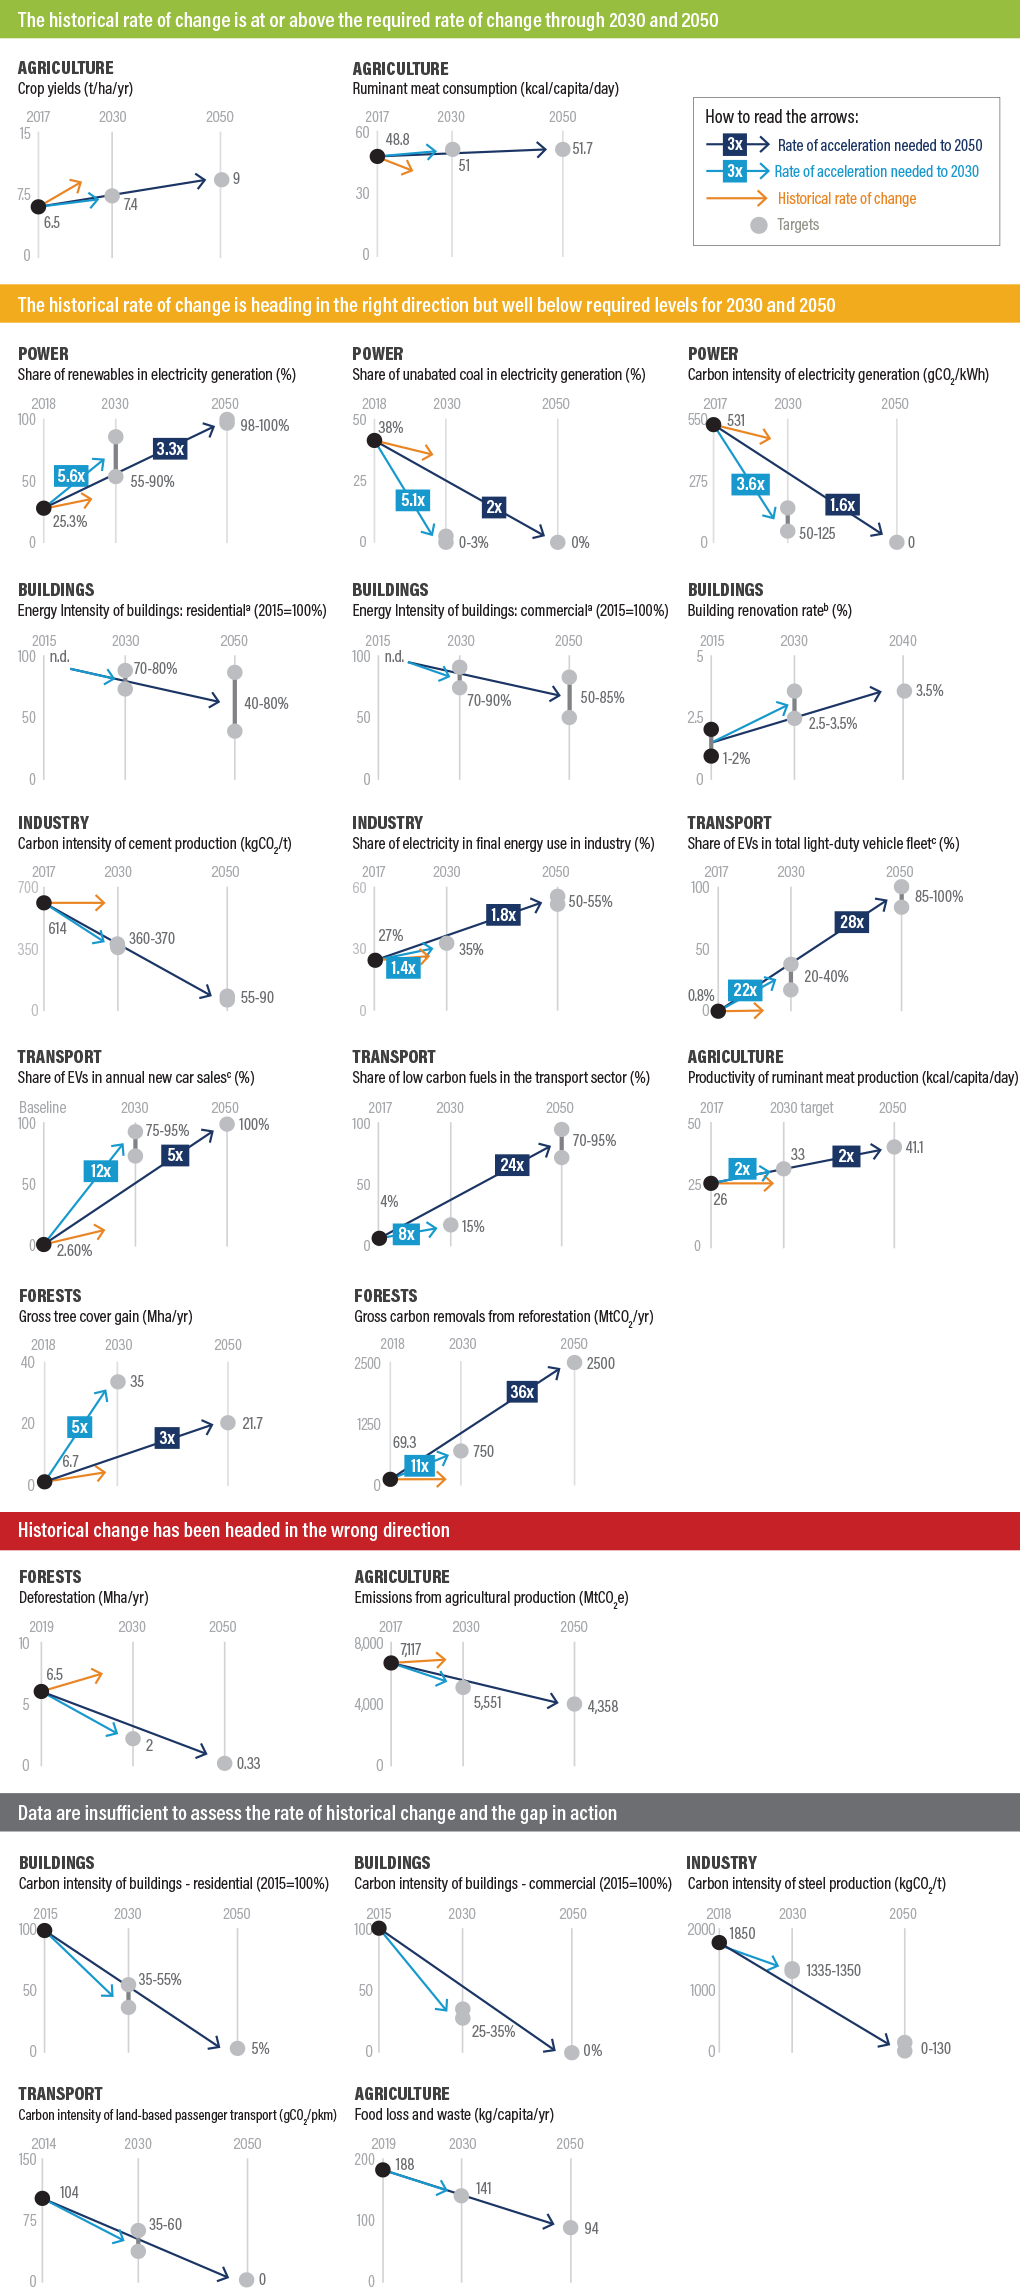
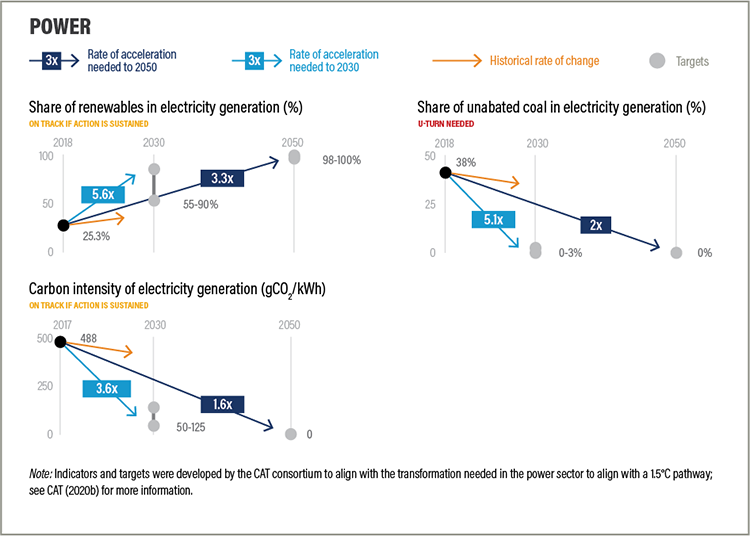
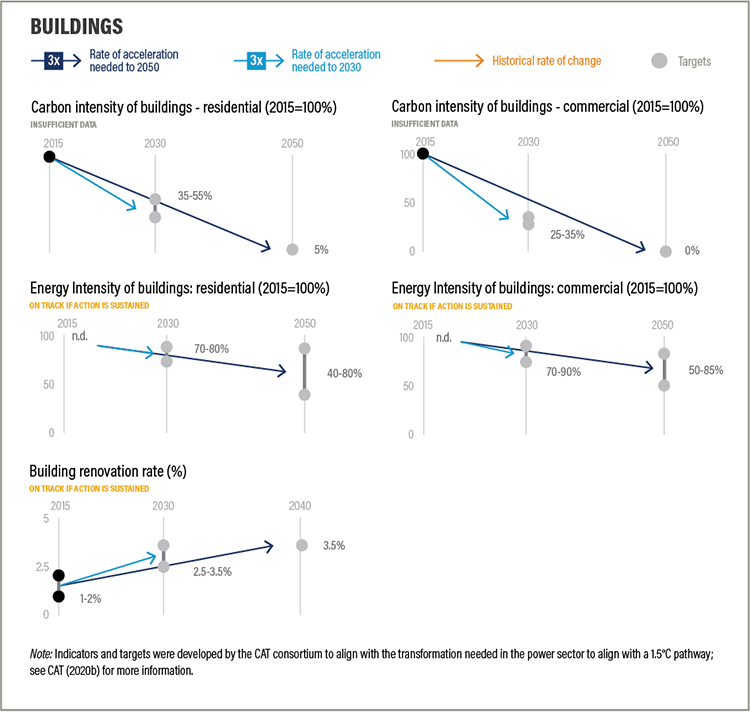
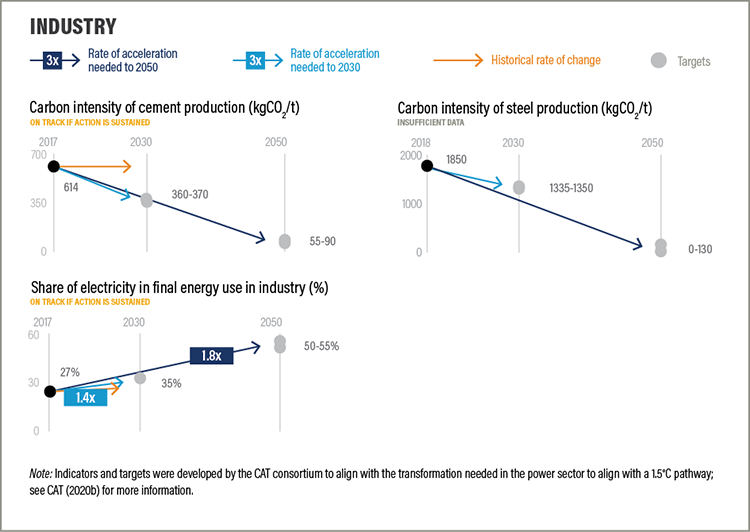
To assess progress toward the 2030 and 2050 targets, we calculate the historical rate of change for each indicator—over the last five years12 to capture the most recent rate of change—and compare that to the rate of change needed to reach the targets for 2030 and 2050. In the large majority of cases, the rate of change needs to increase to reach the targets, so to understand how much acceleration is needed, we have calculated acceleration factors for each indicator that provide an indication of the gap in effort. These acceleration factors show whether the rate of change needs to increase twofold or twentyfold, for example.

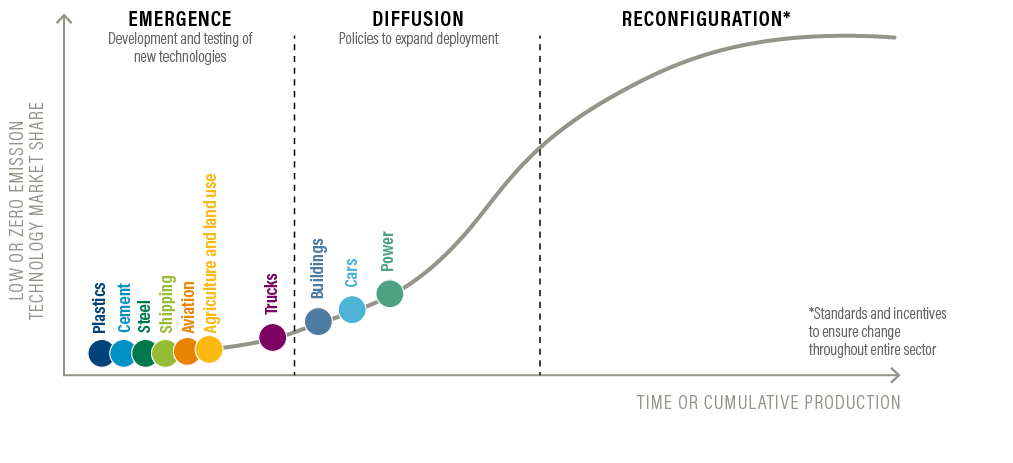
Change very likely will not occur linearly, especially for changes that rely on technology development and deployment, so we cannot simply extrapolate from historical rates of change. The complicated process of systemic change often follows an S-curve, with change occurring at different rates during different stages in the transformation (Figure 13). Importantly, changes that seem impossible at first can, over time, develop momentum, become more durable, and expand to the point where they become the new normal (Victor et al. 2019).

Figure 13 | Systems change

Source: Victor et al. (2019).

Start reading