World Resources Report
Foreword
Our planet needs successful cities-cities that are centers of innovation and productivity, cities where every family thrives, cities that realize the promise of low-carbon prosperity.
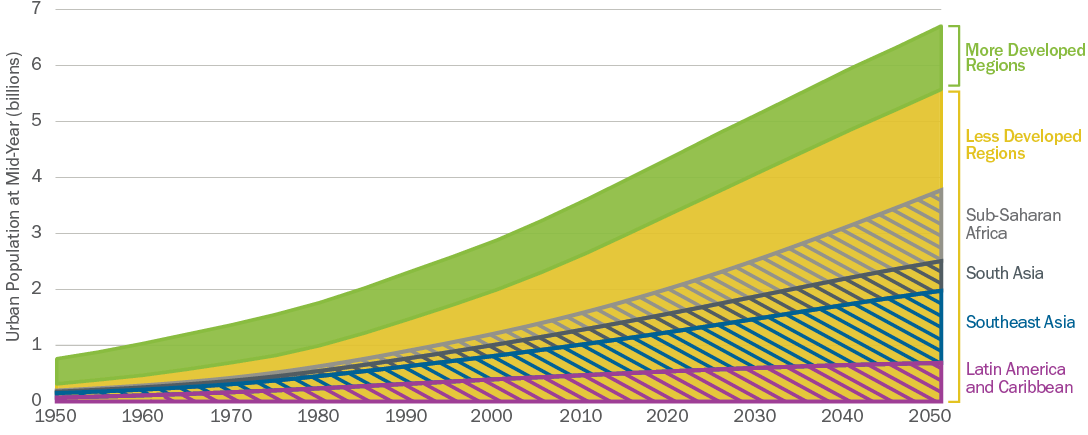
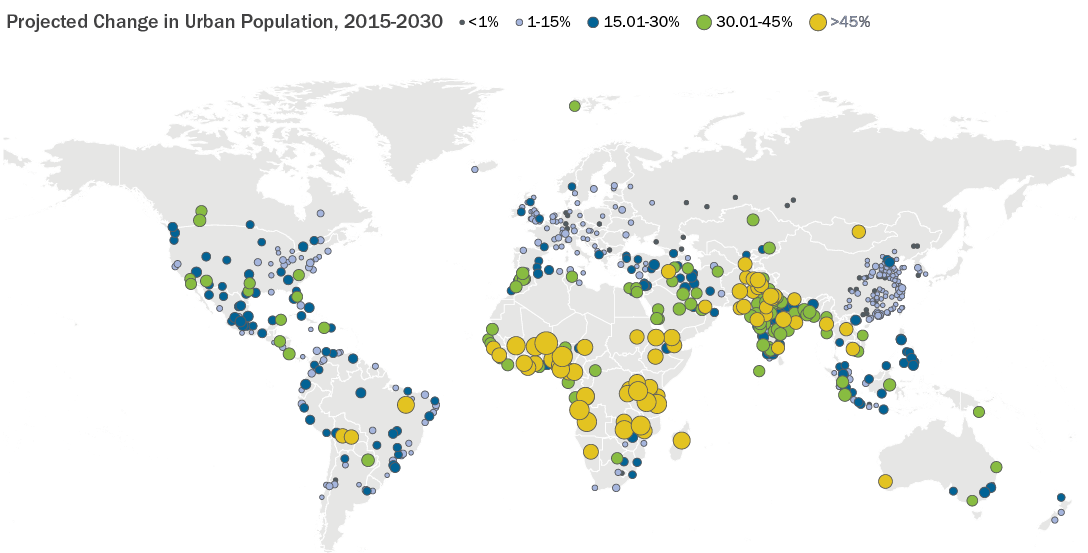
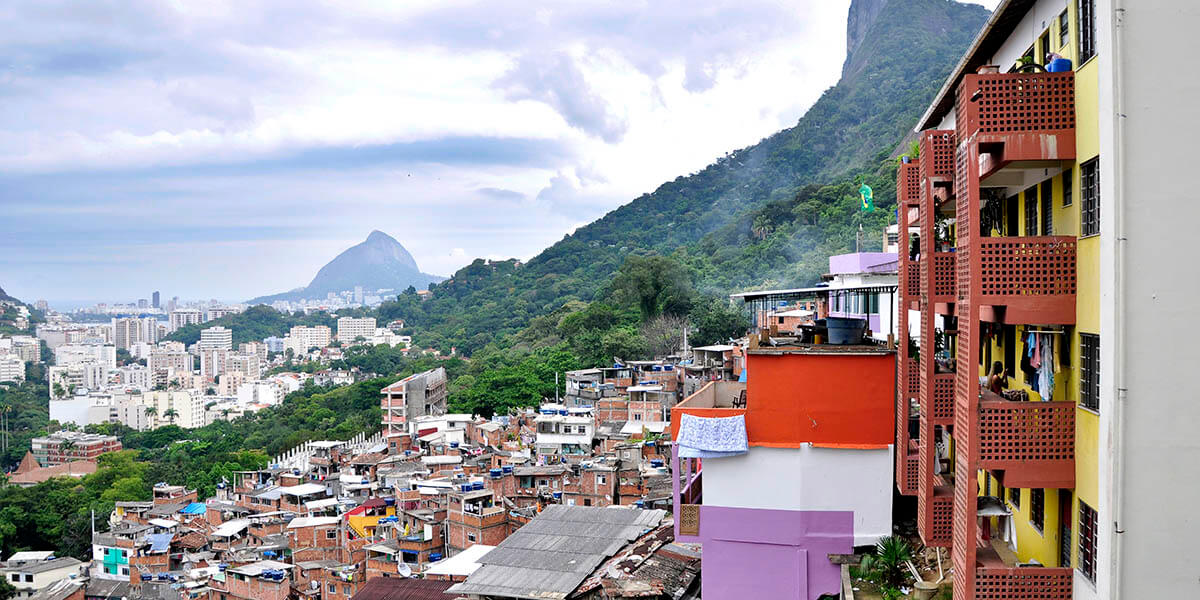
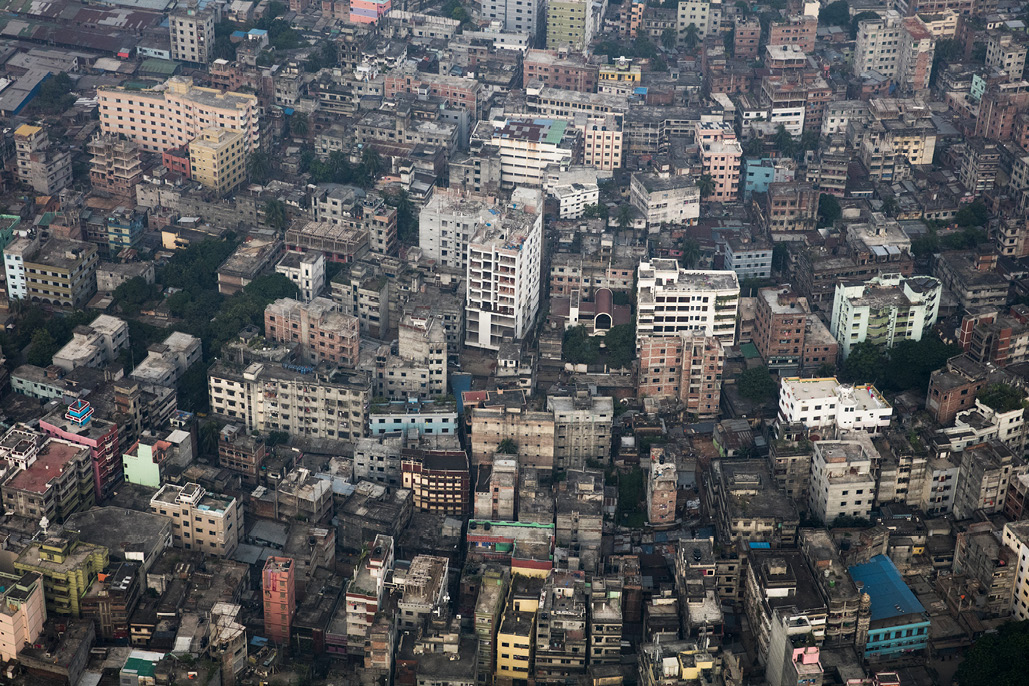
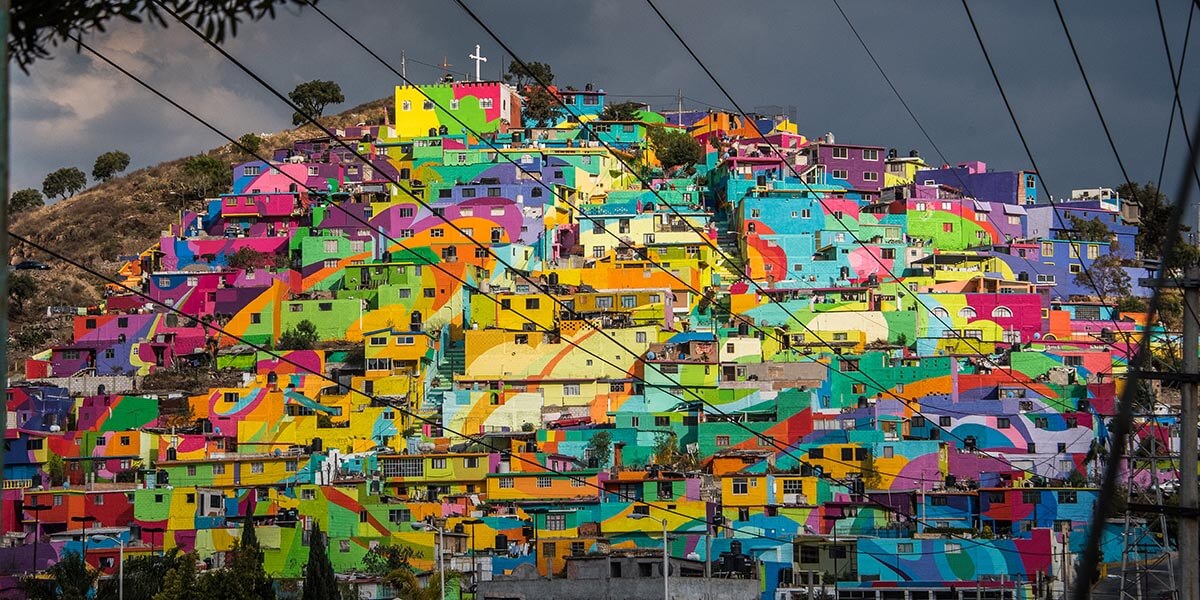
We are not yet building the cities we need. One in two people live in cities and 2.5 billion more will do so by 2050. Cities produce over 80% of GDP but also 70% of global GHG emissions. Our cities are growing, while inequality widens and livelihoods dwindle. Urban infrastructure is not keeping pace with the surge in residents. With many cities already struggling to meet people's basic needs, global development and climate challenges are increasingly urban challenges. A sustainable future depends on whether cities can transform. Is there a path to transformative change that can make cities more prosperous, more equal, and low-carbon at the same time?
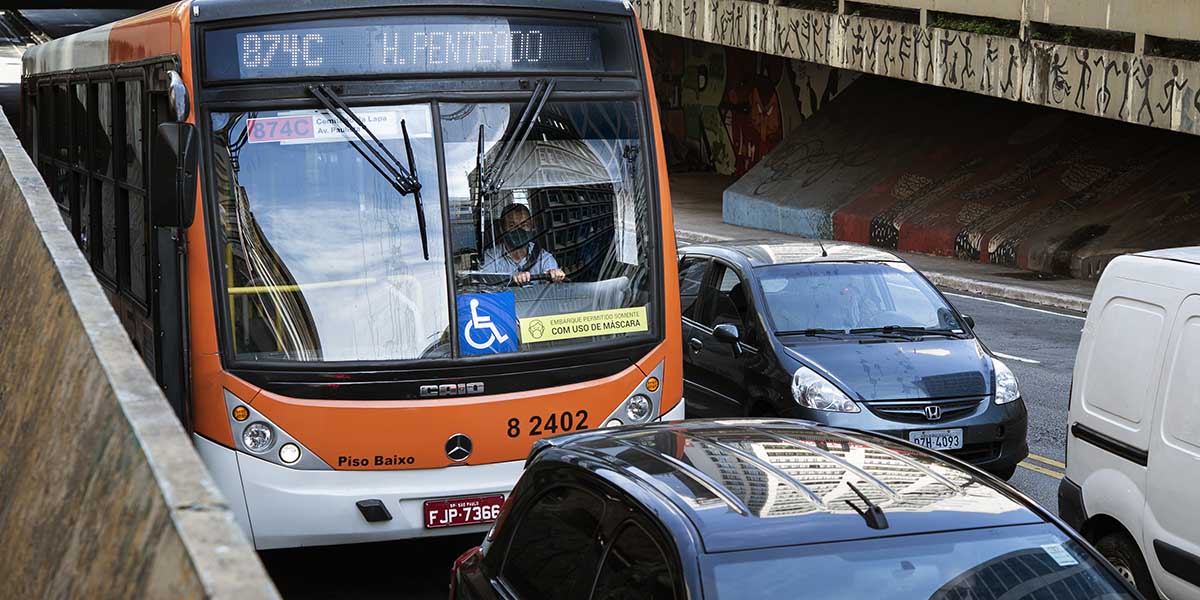
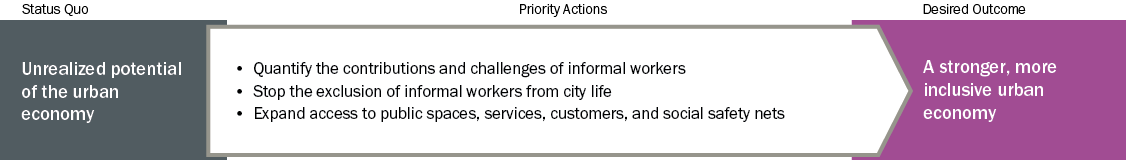
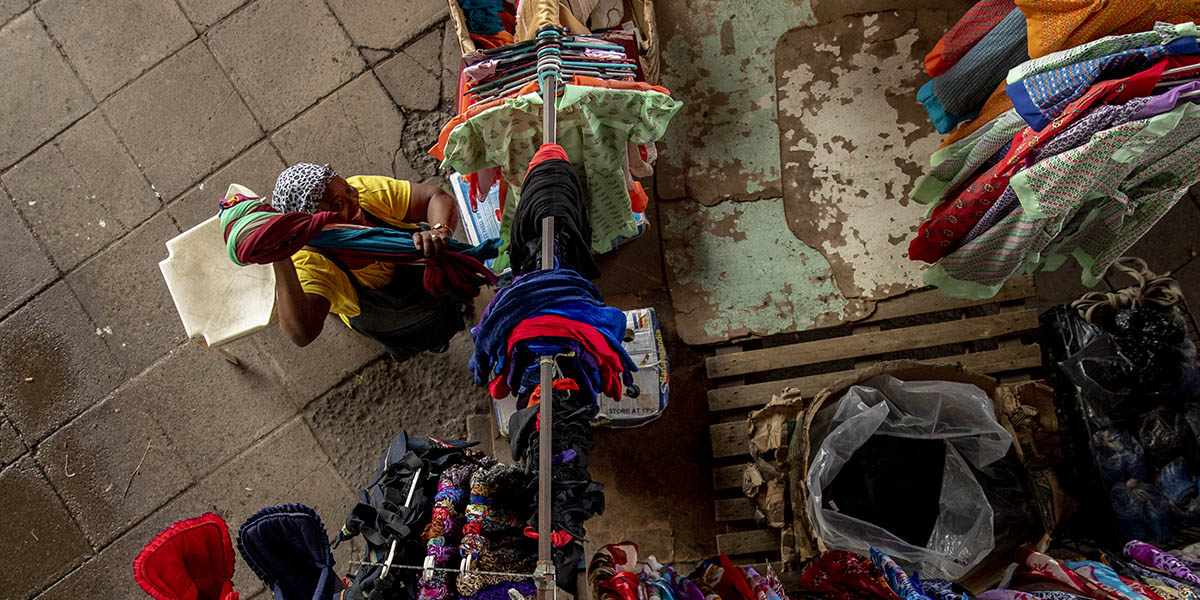
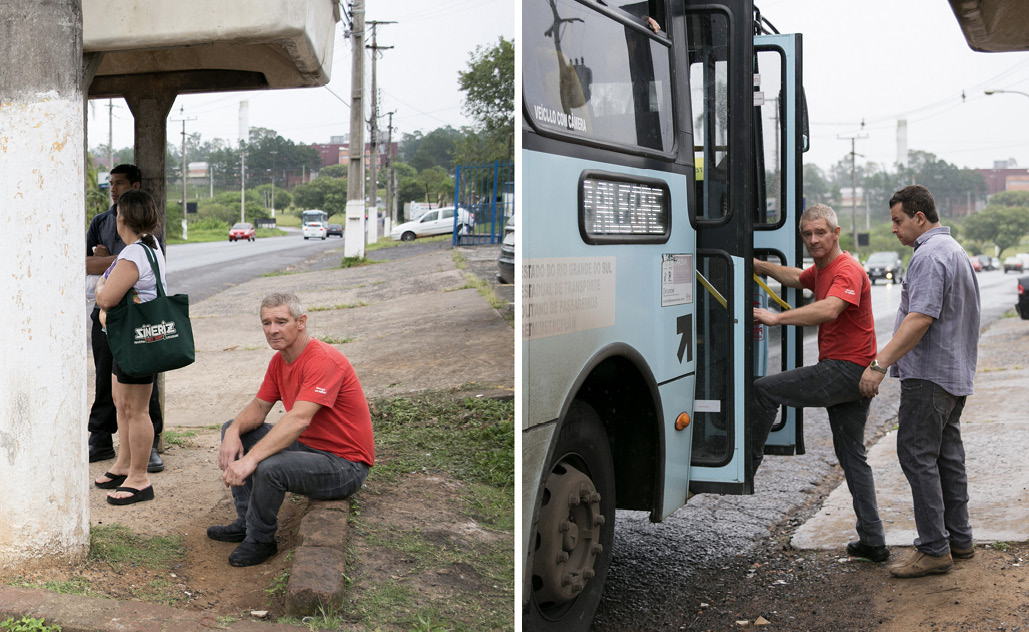
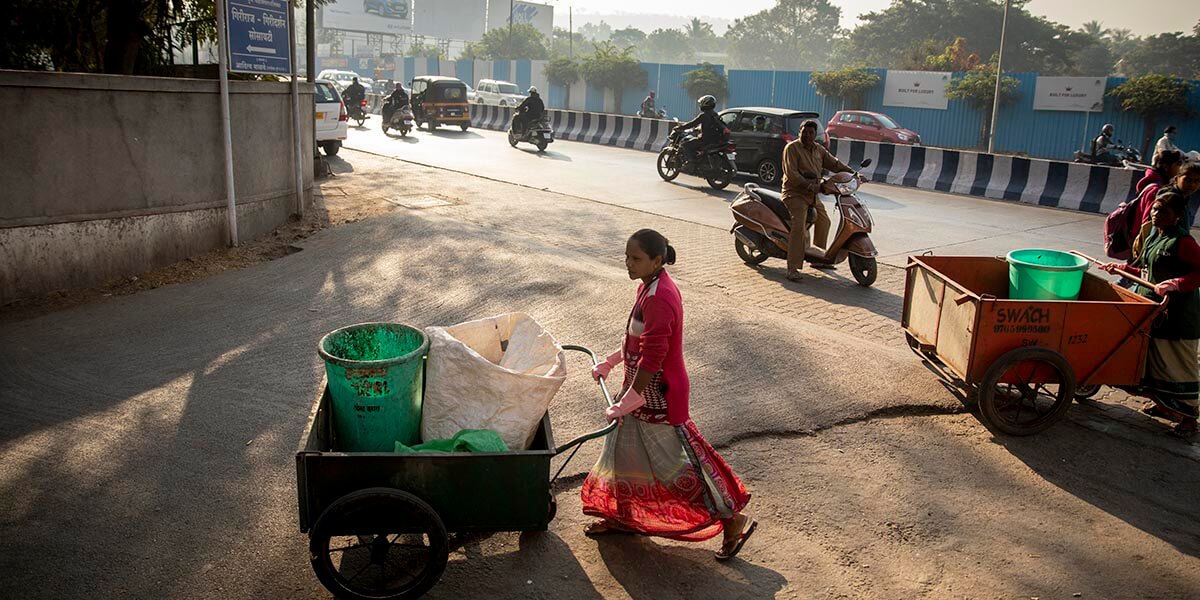
The COVID-19 pandemic has devastated cities, exposing long-present inequalities. The urban poor are much more vulnerable to disease without even simple measures to protect themselves. And it is not only lives lost, but livelihoods. The pandemic pushed millions more people into urban poverty, often with no social safety net. The 2 billion informal workers who pick up waste, do construction, drive minibuses, sell goods on the street, and do domestic work are engines of growth and productivity in many places. Cities cannot function when informal workers are unable to participate fully in the economy. Cities must emerge from this crisis with a deliberate focus on tackling inequality.
The time is now for more sustainable urban development. There is a narrow window to limit global warming and adapt to climate impacts. We need radical shifts in the way we use energy, produce food, manage land, and live in cities. And we must invest much more in building resilience. Trillions of dollars of stimulus spending for COVID-19 recovery has opened a once-in-a-generation opportunity to reset and reshape our economies-but it must be a green recovery. We must invest in more equitable and sustainable cities that are better prepared for the next crisis.
Urban leaders should chart a new path with equity at its core. Historically, cities have been founts of innovation and leadership. A handful of forward-thinking cities have made breakthroughs in recent years. But most cities remain on the path of unequal, unsafe, polluting growth while re-creating known failures. We need to rapidly transform how all cities around the world are built, managed, and experienced.
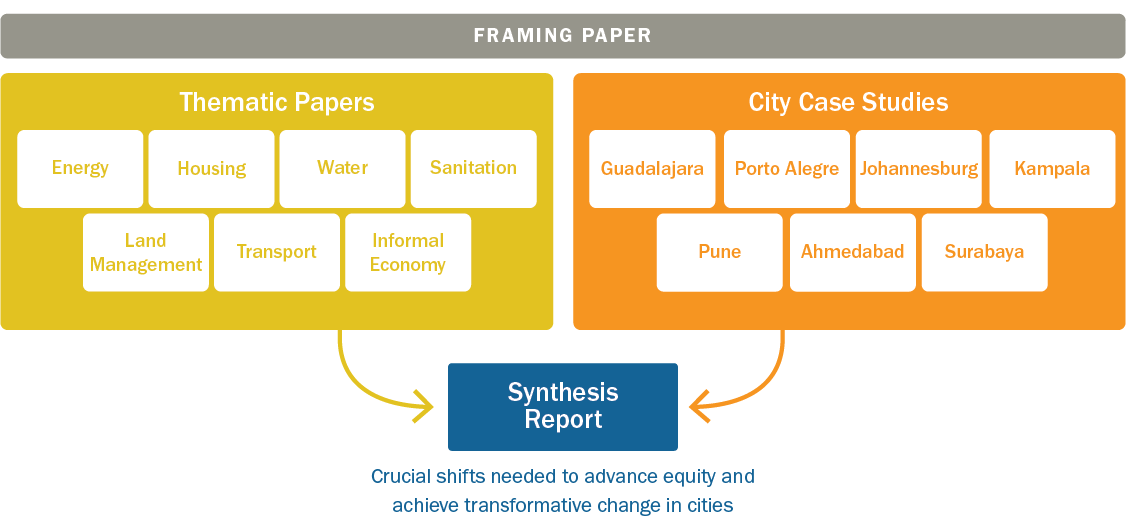
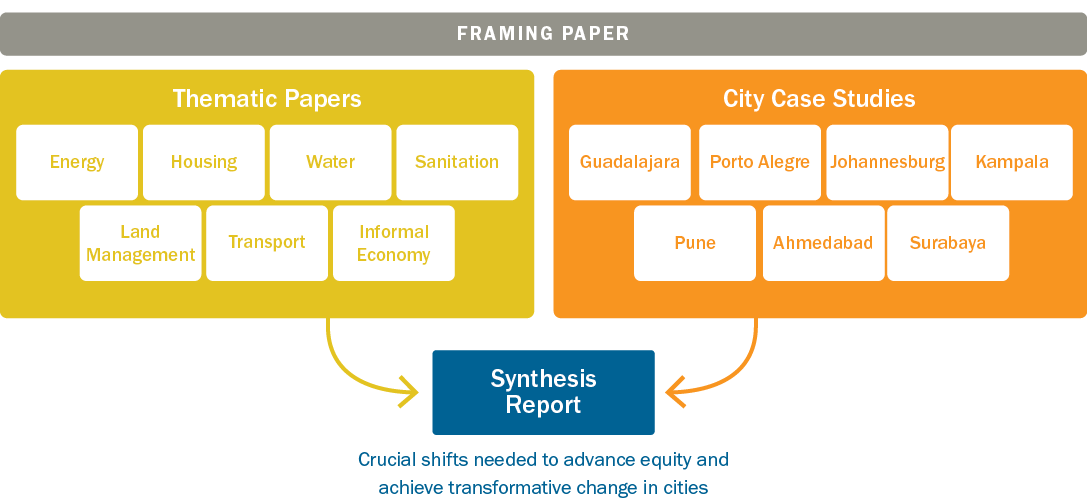
This synthesis report is the culmination of six years of work from 160+ authors and reviewers across the globe. It offers a roadmap for how to unleash transformative change in cities. We present the best thinking on priority actions and investments that can create prosperity and improve livelihoods for everyone. It is as relevant for Houston or Madrid as it is for Delhi or Lagos.
When we began this research, we asked if cities could thrive by prioritizing the needs of the under-served. The answer is a resounding yes. In fact, we can create the cities we need only if we focus on ending inequality and invigorating livelihoods. But there is no time to waste.
Ani Dasgupta
President & CEO, World Resources Institute
Why This Report Matters
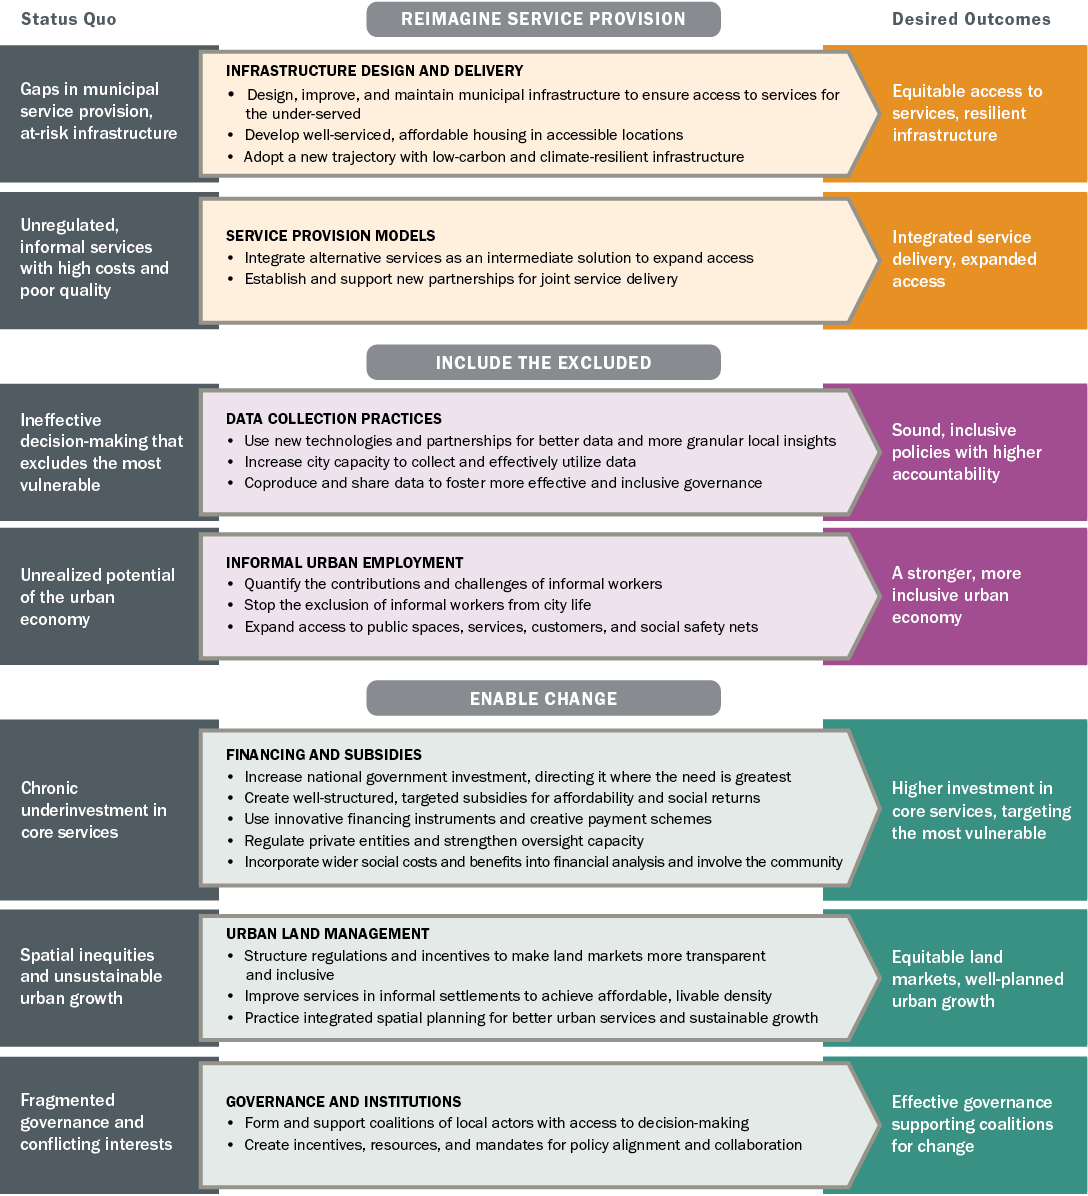
The pandemic has exacerbated existing spatial inequalities and exposed new vulnerabilities. We now need to address systemic inequality in cities head-on, going back to housing, public spaces, basic services, mobility, and connectivity to implement the New Urban Agenda in order to achieve the Sustainable Development Goals. This also means providing access to social safety nets and supporting cities to create financial resilience. Such an approach comes with a unique opportunity to invest in low-carbon and climate resilient infrastructure, while promoting multilevel coordination. This well-researched World Resources Report draws from diverse experiences in rapidly changing cities to ground this vision by proposing seven concrete transformative pathways to build a more just, green, and healthy future.
Maimunah Mohd Sharif
Executive Director, United Nations Human Settlements Programme (UN-Habitat), & Under-Secretary-General of the United Nations

Rapid and growing urbanization, increasingly concentrated in intermediate cities, raises questions of territorial equity and access to urban infrastructure, services, and opportunities. The COVID pandemic has highlighted the important role that local actors can play in providing rapid responses and solutions. We, at AFD, remain committed to supporting cities, alongside our partners such as WRI, in achieving the necessary urban transformations to meet these challenges and improve resilience to climate change. We thank WRI for the excellent report and recommendations and look forward to furthering our collaboration in this domain.

Rémy Rioux
Chief Executive Officer, Agence Française de Développement (AFD)
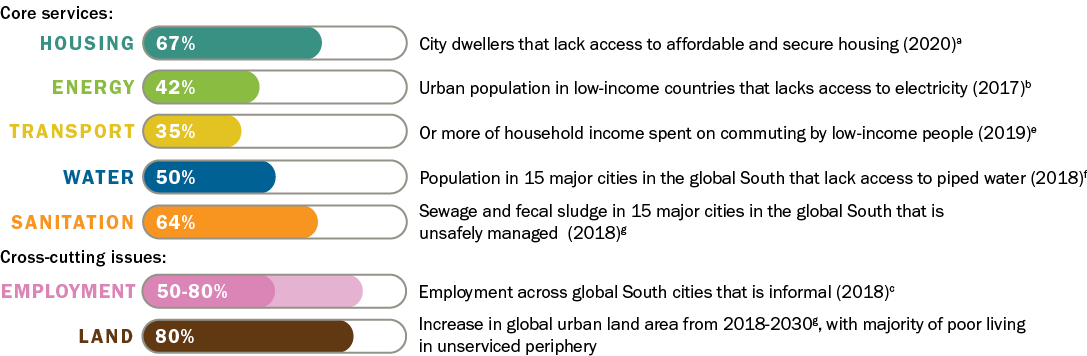
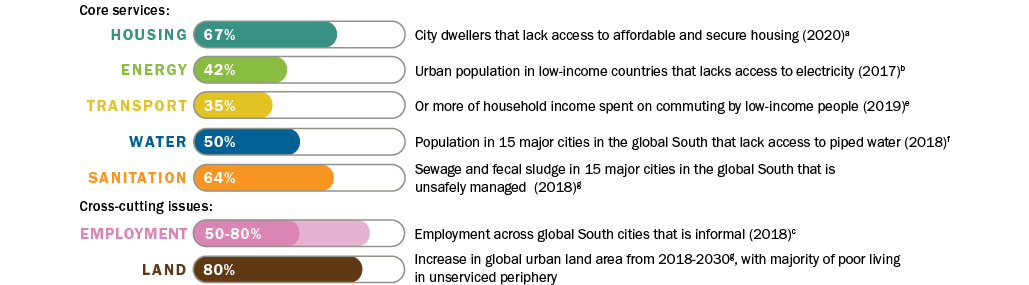
Quality of life in our cities is closely associated with the infrastructure that forms the fabric of daily urban life. WRI's striking report reminds us that globally, a third of city-dwellers have insufficient access to services such as decent housing, transport, energy, water, and sanitation.
The world is facing a climate emergency and it's vital that cities are equipped with the tools to tackle these challenges and address inequalities. The case studies and recommendations of this timely report do an excellent job of supporting that work, to help drive the global transformation we need.
Shirley Rodrigues
Deputy Mayor for Environment and Energy, City of London, United Kingdom
WRI's World Resources Report timeously confronts a world, and more specifically a global South, in a state of recovery from a devastating COVID-19 pandemic which has deepened the significant structural disadvantages which predated it. Poverty and inequality have increased across the board while the impacts of climate change and resource degradation continue to rise. City governments are at the frontline of programmatically addressing these challenges. The seven crucial urban transformations outlined in this report provide a great platform for leaders to critically analyze services offered to the most vulnerable while also attracting the much-needed investment to facilitate inclusive economic recovery and development.
Parks Tau
Member of the Executive Council (MEC), Gauteng Department of Economic Development, Environment, Agriculture and Rural Development, South Africa
COVID-19 has further exacerbated inequality in every aspect of urban life. People living in confined spaces with limited access to public infrastructure and services and depending on precarious working conditions have been hit harder by the pandemic. The report could not come at a more appropriate time. It addresses the pressing problem of inequality from a holistic perspective and undertakes the endeavour to find integrated solutions. It thus confirms our experience: lack of access to basic infrastructure and services is not only a major development obstacle but a growing impediment for creating climate-friendly and resilient urban space. Solving it requires integrated, multi-level and multi-stakeholder approaches.
Ingrid-Gabriela Hoven
Managing Director, Deutsche Gesellschaft für Internationale Zusammenarbeit (GIZ) GmbH
Urban transitions are vital for people and the planet. Our cities hold the keys to liveability, sustainability, and the security of jobs and services for the majority of the world's people, but reform is urgent. Almost half of global carbon emissions can be eliminated if cities become carbon-free zones and use their procurement power to demand carbon-neutral production and services. Likewise, they can ensure people's rights and decent work within their boundaries and beyond, but they must be financed and municipal authorities must engage employers, workers, and communities in just transition plans. The World Resources Report lays out a critical roadmap.
Sharan Burrow
General Secretary, International Trade Union Confederation (ITUC)
This World Resources Report brings together a wide range of insights on pre- and post-COVID urban innovation, into a clear seven-step implementation framework. If local governments, businesses and citizens put their collective shoulders to these wheels, cities across the world could become more equal, prosperous and resilient, accelerating the transformation towards global sustainability.

Aromar Revi
Director, Indian Institute for Human Settlements (IIHS) and Co-Chair, UN Sustainable Development Solutions Network (SDSN)
Life on planet earth has suffered significant impacts on all sectors of the population because of COVID-19. The development of new models and adaptations for more equitable cities will be the best way to integrate and implement change strategies, leading to the transformation of our cities. This will require intelligent governance that provides a path to develop and implement development agendas with a clear vision of the future for cities and communities. The seven transformations provide such a framework. They apply technologies, knowledge, and digital capacity to processes, products, assets, and public policies to improve efficiency, improve quality of life, manage risk, and discover new income-generating opportunities.

Martha Delgado
Vice Minister of Multilateral Affairs and Human Rights, Mexican Ministry of Foreign Affairs
Towards a More Equal City does not shy away from the sobering and unvarnished truths about the impact of inequality on our world. However, this report provides tangible reasons to be hopeful about how the strategic development of our cities can be a path toward equality.

Majora Carter
CEO, Majora Carter Group LLC
This WRI report starkly demonstrates the hidden toll of inequalities in access to public services in cities. Income alone, the report argues, is no longer a sufficient barometer for quality of life. The human, economic, and environmental costs of private vehicles, dirty energy, contaminated water, pollution, and climate risks are inextricably linked to issues of inequality. These challenges can all be tackled together through the research-based solutions and wealth of examples in this report. With the most vulnerable on the frontlines, partnering with communities on the ground to put the solutions outlined into practice must be an immediate priority.
Manish Bapna
President and Chief Executive Officer, Natural Resources Defense Council (NRDC)
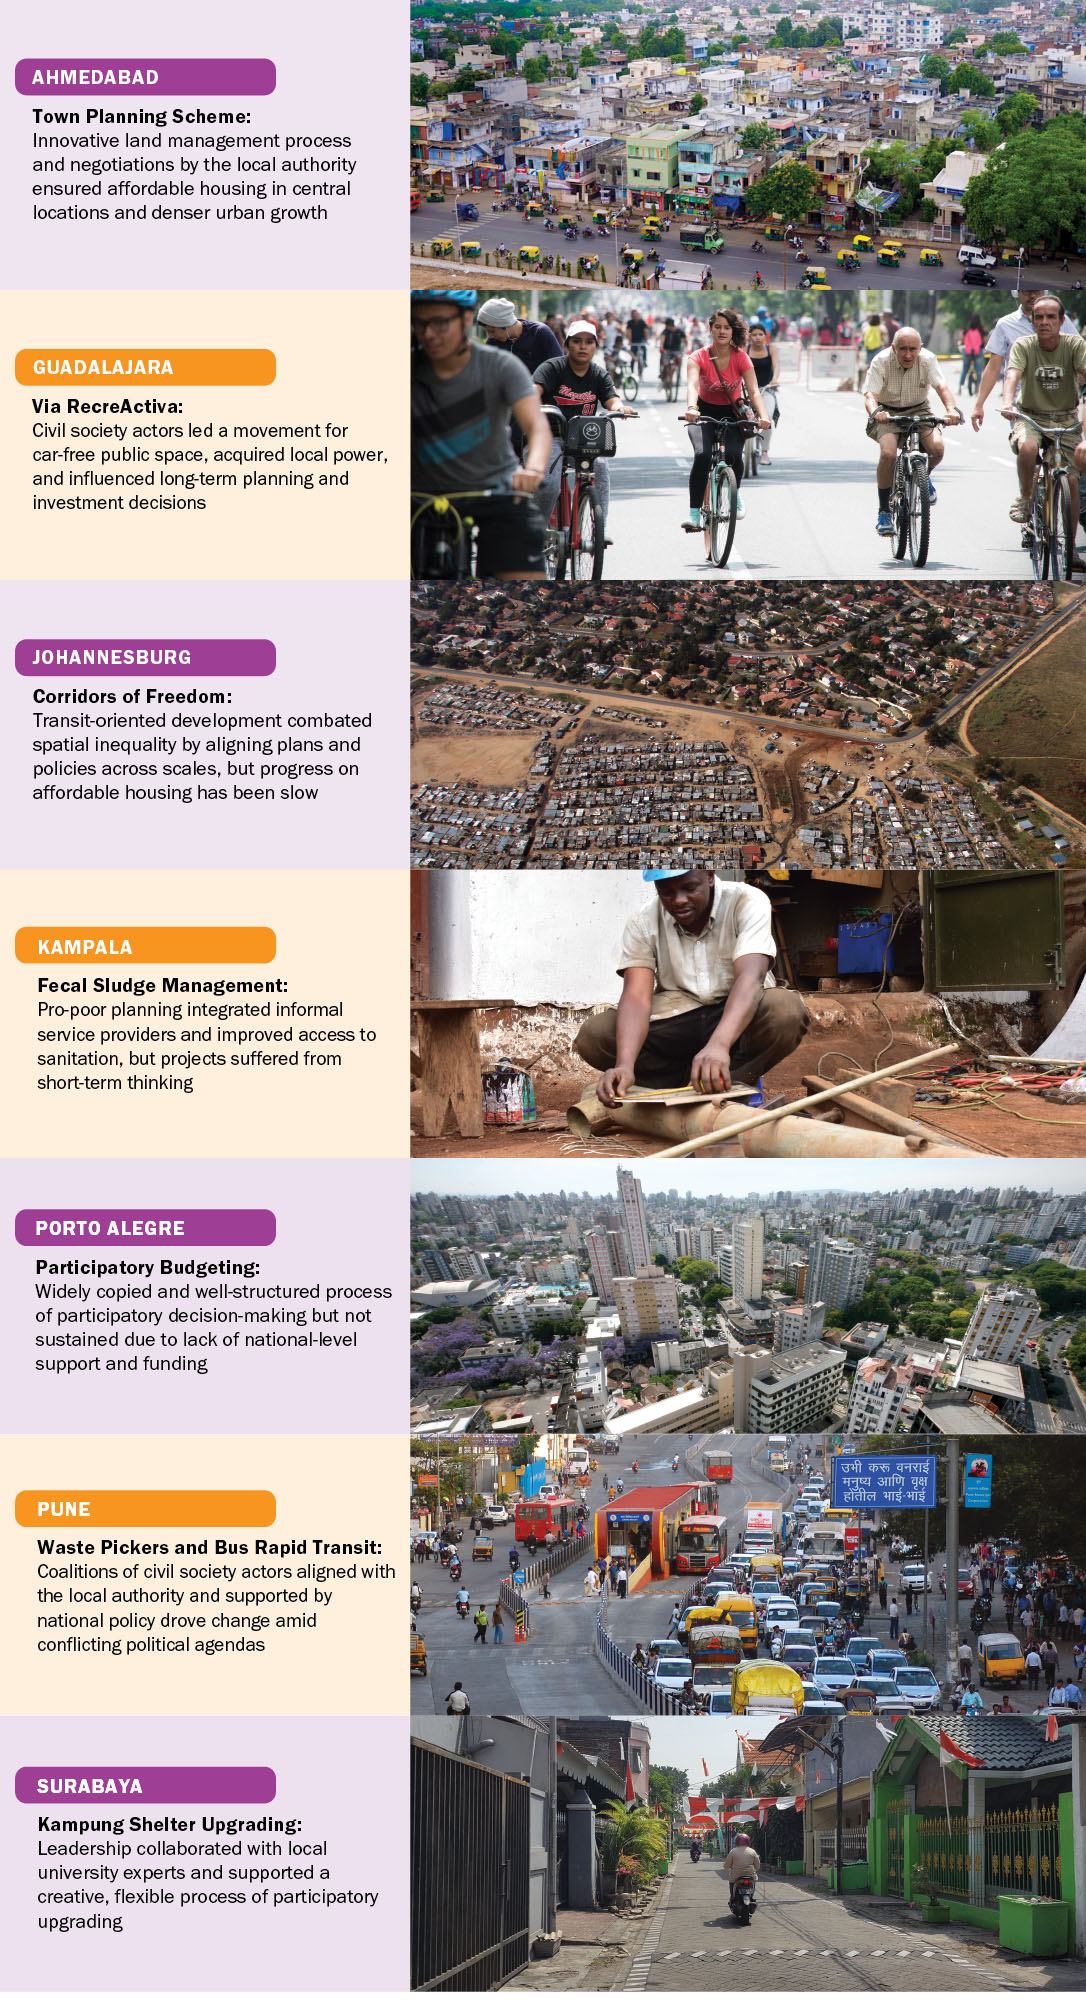
India's urban population is projected to double by 2050 and the quality of this urbanization is critical to ensuring India meets the Sustainable Development Goals. For us, smart cities are livable and sustainable cities with economies that work for all, particularly the most vulnerable. Aligned with this report, I believe that the achievement of these outcomes hinges on effective use of data and technology, innovative financing, able governance, and integrated, climate-sensitive urban planning. The report offers practical knowledge on transforming urban practice on these tenets, with many examples to learn from. Its guidance on improving livelihoods for informal workers and engaging them in the vision for a better city is refreshing. I am glad to see Pune and Ahmedabad included as city case studies and am keen to advance this agenda in our future endeavors.

Kunal Kumar Joint Secretary & Mission Director (Smart Cities Mission), Ministry of Housing and Urban Affairs, Government of India
At a time where cities have become major players in the field of sustainable development, this report helps identify key strategies to respond to the current challenges comprehensively. With a growing share of both people and economic activity in urban areas, low-carbon cities will certainly be key to reducing climate risks. But the way they handle it can exacerbate or minimize inequality. For instance, Africa cannot focus narrowly on climate mitigation alone; they must also find ways to reduce poverty, create decent jobs, and reduce pollution. It is therefore essential to identify low-carbon measures that also deliver real improvements in people's lives.
Carlos Lopes
Professor, Mandela School of Public Governance, University of Cape Town
The battle for a sustainable future will be won or lost in the world's cities. This superb report is a good news-bad news story. It shows how cities can dramatically transform themselves to become low carbon, inclusive, creative, and productive-and that this transition is good for people, planet, and even politics. But the shift isn't happening nearly fast enough. In most cities carbon emissions are still rising, along with inequality and congestion. City, national, community and corporate leaders should seize the opportunities this report offers while there is still time.

Andrew Steer
President and CEO, Bezos Earth Fund
Emerging cities, particularly in India, are growing at an unprecedented rate. We must see them as an opportunity for effecting transformative positive change towards low carbon cities. Local, state, and national governments can play an important role with the private sector in delivering clean water and energy, housing, and transport. The right regulation and pricing can help control the waste of natural resources, while improving the health and livelihoods of all urban dwellers. Addressing fundamental issues of poverty and inequality in cities is essential to building resilience. We need a manual for a shift to low-carbon, sustainable, inclusive urban development, and the World Resources Report is that manual.
Jamshyd Godrej
Chairman and Managing Director, Godrej & Boyce Mfg Co. Ltd.
Chinese cities are undergoing unprecedented urbanization. 99% of the urban residents in Chinese cities have secured the access to clean water, public transport services, and grid connections and we must ensure these core services are available for residents in all new towns or redeveloped urban centers. The per capita housing area in cities has reached 40 square meters and through good spatial planning, we can ensure housing is well connected to services and opportunities for all people. Despite the progress, Chinese cities still confront serious impacts from climate change, urgency for low-carbon transitions to meet the country's 2060 carbon neutrality commitments, and amenity and service gaps for an aging society and emerging middle class. Through the release of World Resources Report, we hope to exchange best practices and lessons learnt with global peers towards a shared equal and sustainable future.
Qiu Baoxing
Former Vice Minister of Housing and Urban-Rural Development, P. R. China and Counsellor of the State Council, P. R. China
I am not hopeful. I am certain. We know what is causing climate change. Cities are clearly at the frontlines. A warming planet will have increasingly devastating effects on our lives, livelihoods, economies, health and security, disproportionally affecting those that have the least. Addressing inequalities must be central to our actions. We can absolutely avoid the worst and build a better world in the process. This is the single most important decade in human history to take urgent action to tackle inequality at the same level as the climate crisis. Global efforts hinge on how cities will meet this challenge.
Kitty van der Heijden
Director General for International Cooperation, Ministry of Foreign Affairs, Netherlands
Suggested Citation: Mahendra, A., R. King, J. Du, A. Dasgupta, V. A. Beard, A. Kallergis, and K. Schalch. 2021. “Seven Transformations for More Equitable and Sustainable Cities.” World Resources Report, Towards a More Equal City. Washington, DC: World Resources Institute. https://doi.org/10.46830/wrirpt.19.00124.