Executive Summary
Highlights
- Carbon removal will be needed, likely at a large scale, to limit global temperature rise to 1.5°C, which is necessary to avoid the worst impacts of climate change; direct air capture (DAC) is one carbon removal technology that is receiving growing investment and interest. Understanding its environmental and social impacts will be critical to scaling up equitably.
- DAC plants are expected to have similar on-site resource usage impacts as other types of industrial infrastructure (e.g., land, energy, and water use), but significantly less on-site greenhouse gas (GHG) and conventional air pollutant emissions, particularly if powered by renewable energy. Responsible project design and regulation under the existing U.S. environmental regulatory framework can reduce adverse environmental impacts.
- At the same time, because DAC is an emerging technology and its impacts vary by project, assessments will be needed on a project-by-project basis to understand expected environmental and social impacts in relation to alternatives or a no-action scenario.
- Social impacts depend on the degree to which potentially impacted communities have access to information and can provide input into siting and project development decisions. Enactment of policies that require consideration of equity in DAC development will be necessary to avoid historical patterns of inequitable infrastructure siting.
Background
Limiting global warming to 1.5°C, as set out in the Paris Agreement, will require carbon dioxide (CO2) removal from the atmosphere (IPCC 2018; NASEM 2019). This must be a complement to, not a substitute for, deep reductions of greenhouse gas (GHG) emissions. Carbon removal includes natural approaches, like planting trees, and technological approaches, like direct air capture (DAC), which uses chemicals to capture CO2 from the air, and, when combined with geological storage or sequestration in a durable product, remove it permanently.
Among technological carbon removal options, DAC is attracting investment and interest. Its social and environmental impacts must be better understood, as with any new type of infrastructure. Today, more than a dozen DAC plants are operating worldwide, and plans are underway for two large-scale (0.5–1 million tonnes/megatons of carbon dioxide per year [MtCO2/yr]) plants (Carbon Engineering 2021; Beuttler et al. 2019). These represent only a fraction of the up to 10 billion tonnes of CO2 per year of carbon removal needed globally by midcentury across all carbon removal pathways (NASEM 2019). Given this expected large-scale need for carbon removal, it is important to understand DAC’s social and environmental impacts—both positive and negative. DAC’s nascency provides the opportunity to use this information and community engagement processes to counter historical patterns of inequitable energy and infrastructure siting to scale DAC responsibly from the outset (U.S. DOE 2021).
Key Findings
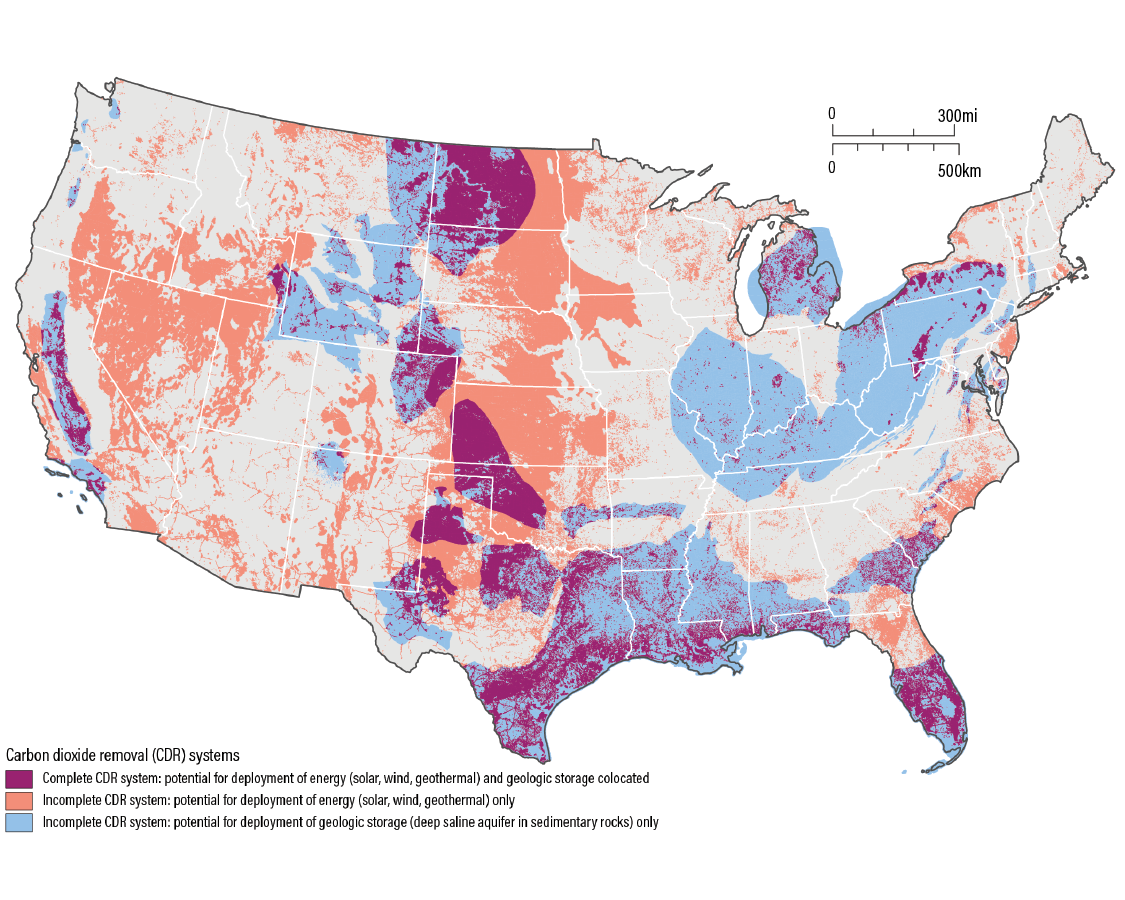
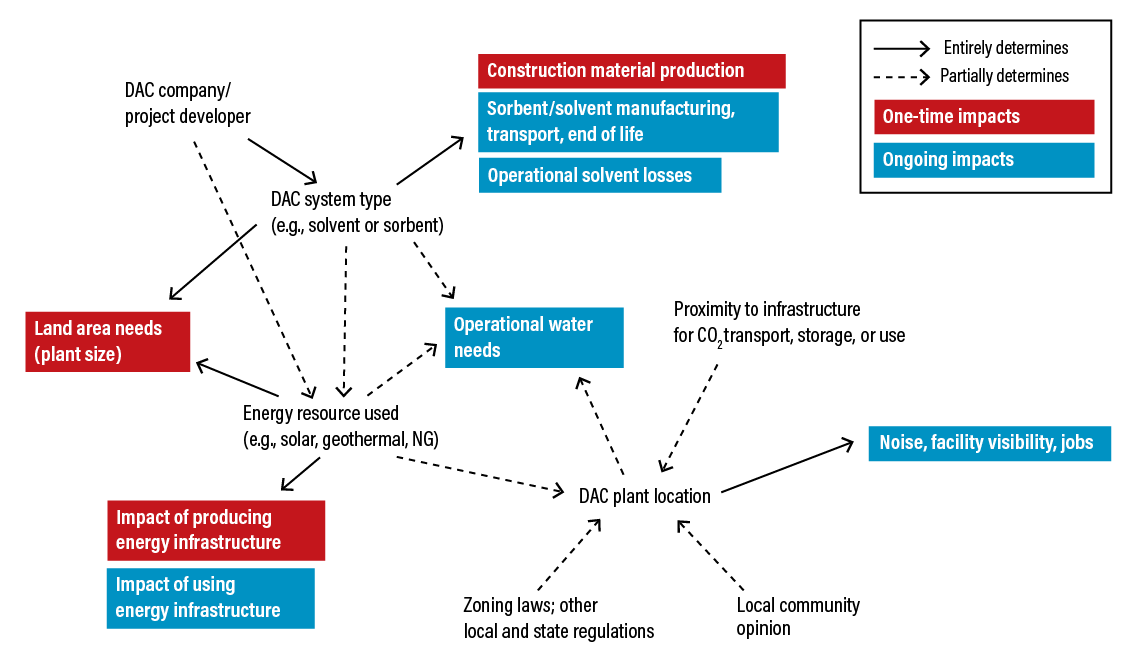
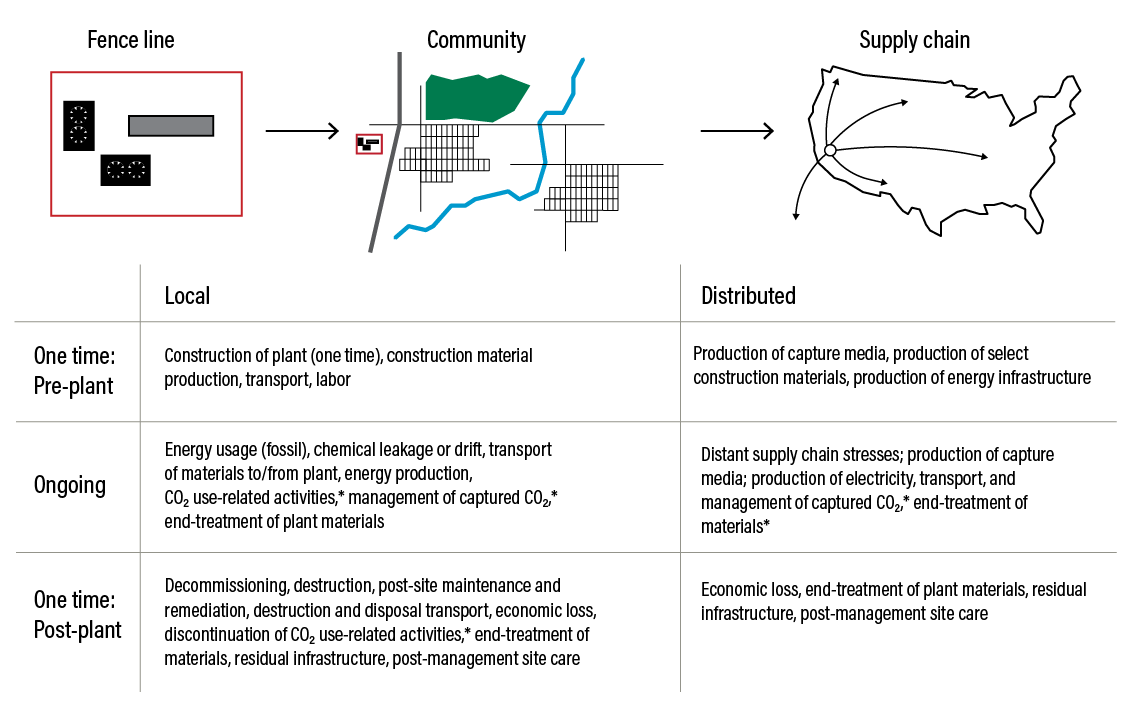
Ongoing impacts of operating DAC plants will come from energy, land, and water use (for DAC plant and energy source), and chemical use for the sorbents and solvents that capture CO2. For a project removing a million tonnes (Mt) of CO2 per year, these impacts would be similar to those of other industrial infrastructure, except that DAC would produce little to no GHG and air pollutant emissions on-site. DAC has siting flexibility, so it can be placed in locations that minimize impacts to people and the environment, for example, in climates that reduce water usage or on marginal land.
- Energy: Using renewables would avoid on-site emissions of GHGs or air pollutants but would be relatively land intensive, while using natural gas with carbon capture would require much less land but would produce small amounts of GHGs and air pollutants and may be less acceptable to some communities.
- Land: At a million tonne scale, solvent DAC plants (excluding energy sources) require roughly 0.4 square kilometers (km2) per plant while sorbent plants require 0.5 km2 (Carbon Engineering 2020; Uzor 2022). By comparison, around 860 km2 of forest is required to capture one million tonnes of CO2 in the United States (Cook-Patton et al. 2020). Land area for energy resources would increase the footprint by 34 km2 or 66 km2 for solar and wind, respectively, at a million tonne scale. This land area could be used for other purposes, however, like grazing animals under wind turbines. In some cases, wind energy could be sited offshore to eliminate land use.
- Water: Water usage is comparable to other industrial uses (Gerbens-Leenes et al. 2018). Locating solvent plants in cool, wet climates can reduce water usage; for sorbent plants, new variations in the technology can make plants net water producers in some locations.
- Chemicals: On-site impacts of DAC chemical usage are expected to be minimal. Solvent DAC plants would release small amounts of solvent aerosols into the environment, but the amount is below the regulated limit (0.2 milligrams/cubic meter [mg/m3] or around 10 percent of the limit). Sorbents used in DAC plants degrade, but these degradation products, including ammonia, would likely be sequestered with the captured CO2 and not released into the environment. Workplace use of chemicals always poses a non-zero risk, but chemical use in DAC plants would not be expected to be meaningfully different from use in other industrial applications, for which workplace handling guidelines mitigate risks.
Scaling up today’s DAC systems will require expanded production of some chemicals. Reaching the half billion tonnes (0.5 gigatons [Gt]) of technological carbon removal outlined in the U.S. Long-Term Strategy, if it were met entirely with DAC (half sorbent, half solvent capacity), would use around a little more than one-third of today’s global sorbent chemical production, the supply chain for which is still in development. Solvent DAC would use around one-fifth of today’s solvent production; scaling up solvent use is not expected to limit DAC deployment at a gigaton scale (McQueen, Gomes, et al. 2021). These amounts are based on sorbents and solvents used in commercially ready DAC systems today—the types and amounts of these chemicals will differ as DAC technology advances.
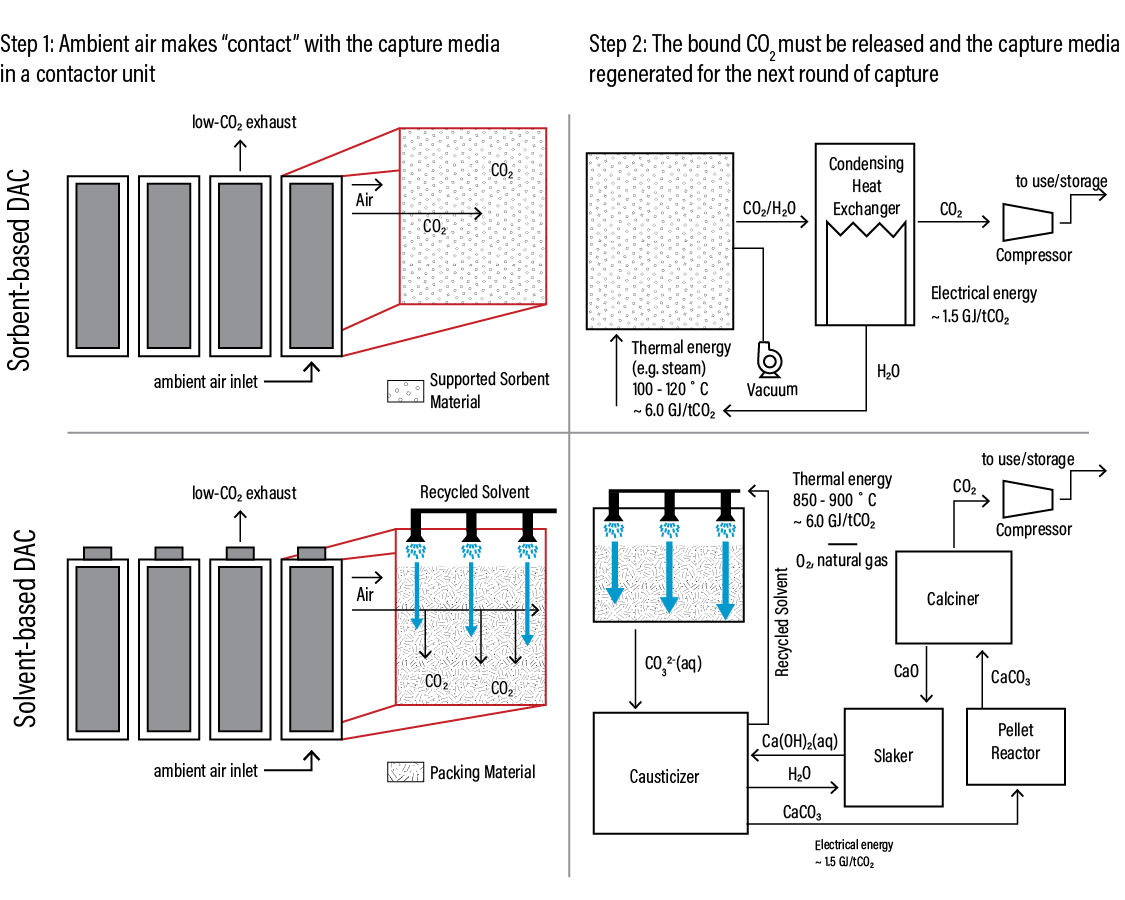
DAC scale-up will require expanding energy infrastructure to avoid competition with other uses for renewables. Based on today’s technologies, at a 1 MtCO2/year scale, a sorbent plant requires an estimated 270 megawatts (MW) of power, and a solvent plant requires an estimated 280 MW of power (Keith et al. 2018; Beuttler et al. 2019).1 With current technology, solvent plants use natural gas to provide high-temperature heat, whereas sorbent plants can use low-temperature heat from renewable energy or waste heat sources. DAC at 0.5 Gt scale would use around 4.4 percent of 2020’s primary energy supply and around 3.8 percent of 2050’s projected primary energy supply (U.S. EIA 2021).2 New energy infrastructure would have upstream impacts associated with the materials supply chain and could impact ecosystems where sited, akin to building energy for non-DAC purposes.
DAC plants will need cement, steel, and other materials for construction, as will new energy infrastructure to power the plants. DAC scale-up would increase demand for materials that are already produced at a multimillion tonne scale in the United States, so near-term demand growth would generally be incremental. DAC at 0.5 Gt scale would use around 1–3 percent of current U.S. concrete and steel production each year. Scaling up materials production would also increase GHG and pollution impacts where those facilities are sited; reducing these materials’ supply chain impacts will require broader efforts from industry and government. DAC plants may also use low-carbon cement and steel alternatives.
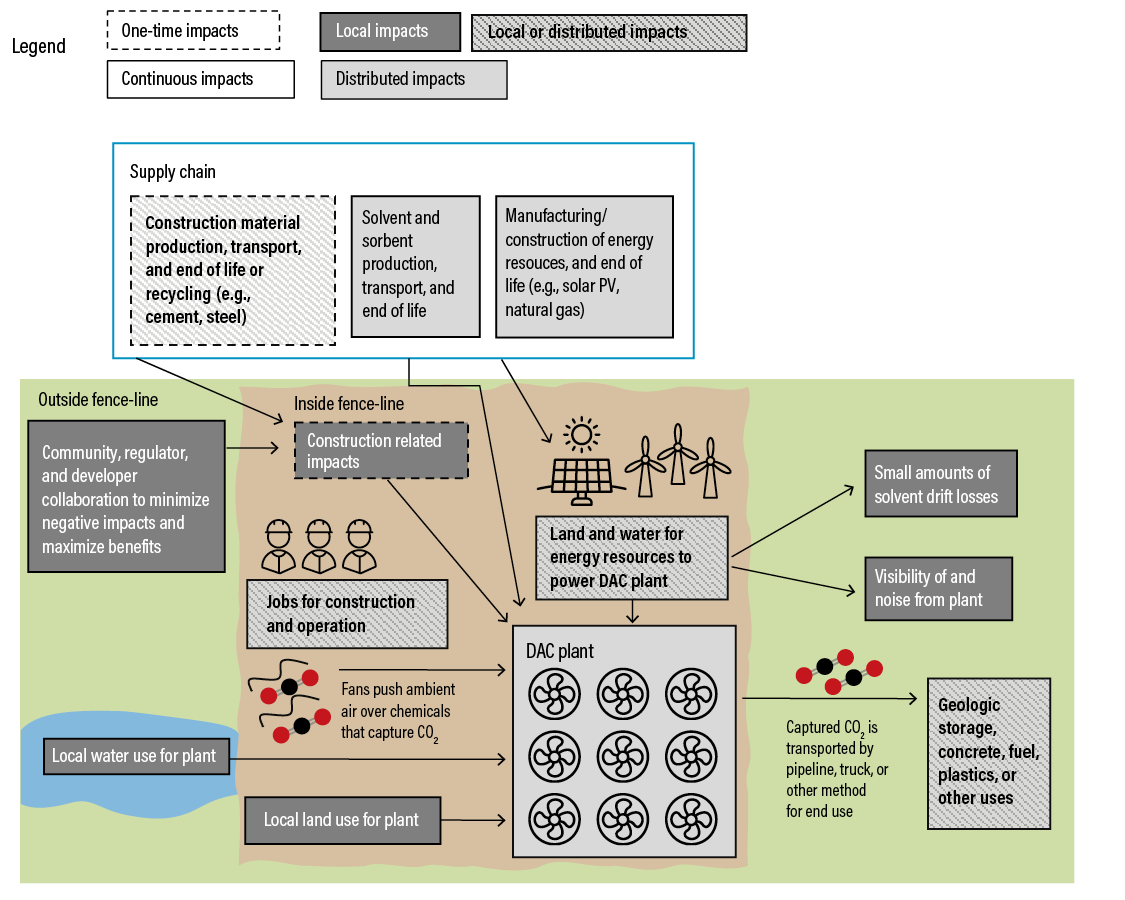
A significant social impact of DAC is expected to be job creation, both on-site to operate the plant and elsewhere associated with manufacturing components and infrastructure. Other benefits could include financial compensation through pore space royalties or benefits codified through community benefit agreements. More work is needed to identify potential benefits and address community needs on a project-by-project basis. Potential social impacts are entwined with environmental impacts and include construction activity, increased traffic, and land use change, which will vary by project.
Since DAC is a new technology that is largely unfamiliar to the public and will require new infrastructure, investing in inclusive community engagement will be critical to responsible scaling. Community engagement should inform equitable decision-making around siting and project development and could help build understanding of DAC. Community engagement can also help maximize community and societal benefits and minimize negative impacts. These efforts my require additional resources but would help lay the groundwork for a more equitable and successful long-term scale-up.
Federal and subnational governments can support equitably scaling DAC through policies, and private sector actors can establish demand-side environmental and equity guardrails. The federal government can invest in foundational research, design, and demonstration; ensure that DAC is appropriately regulated under existing federal regulatory frameworks; and require social and environmental impact assessments (EIAs) and robust community engagement as a precondition to accessing federal funds. State and local governments can enact policies that enable zoning, planning, and permitting powers to support equitable DAC siting and development. In addition to policy guidance, carbon credit–certification programs can incorporate social and environmental impact criteria that must be met before DAC-generated carbon credits can be sold in voluntary markets.
These findings are preliminary as data are not comprehensive and DAC technology is evolving and improving. Data on the environmental impacts of different DAC and energy configurations in various locations will be needed to better understand impacts on a project-specific basis.
About This Working Paper
This paper builds on earlier WRI work on carbon removal—CarbonShot: Federal Policy Options for Carbon Removal in the United States—which identified the likely need for DAC in the United States. It analyzes the expected environmental impacts of building and operating DAC plants in the United States and provides considerations related to decision-making and DAC siting. It was written in collaboration between World Resources Institute and the University of Pennsylvania and is intended to inform policy and stakeholder discussions on DAC scale-up in the United States and to spur further research.