Foreword
Jim West
Michigan has been synonymous with automotive innovation since the birth of the industry. These combustion engine vehicles have radically transformed American and global society over the last century. At the same time, they have also contributed to dangerous climate-warming emissions. Fossil-fuel powered combustion engine vehicles contribute over 80 percent of transportation emissions in the United States, the largest sector of emissions in the country today. It is clear that business-as-usual cannot continue for much longer as climate impacts make themselves more and more evident for Michiganders, the rest of the nation, and the world.
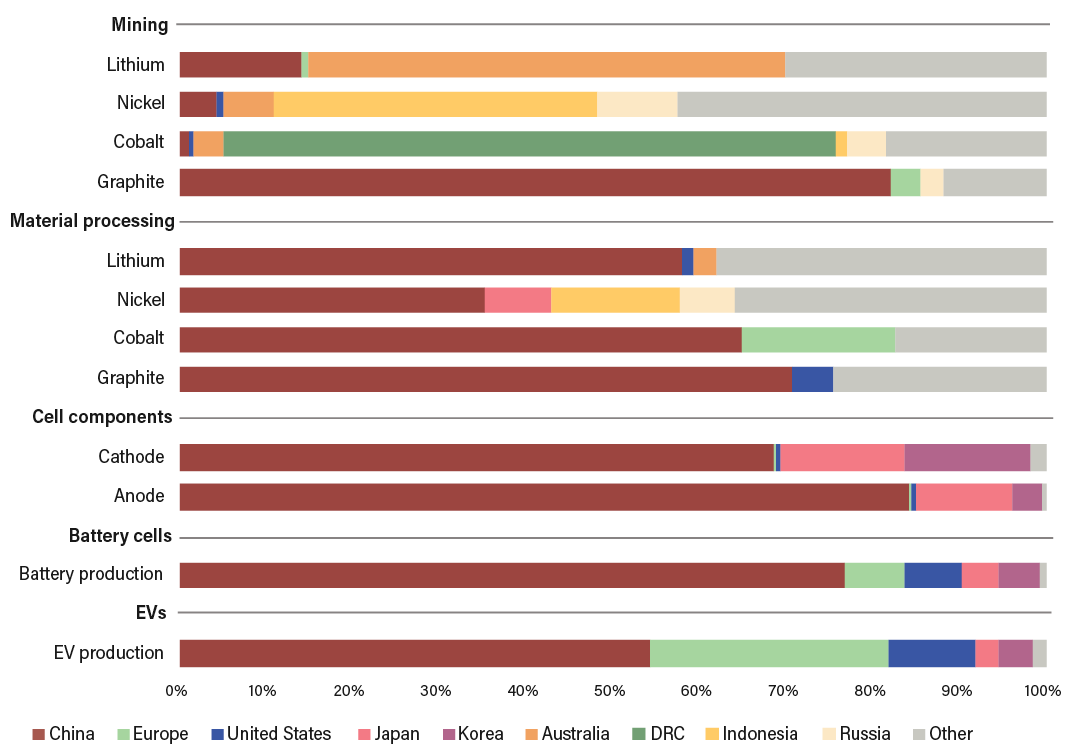
Electric vehicles (EVs) will play a critical role as more countries decarbonize their economies for a climate- proof future. In order to meet its global climate goals, the world needs to accelerate light-duty EV sales by five times. As home to one-fifth of all auto production in the United States, Michigan can seize the opportunity to lead the next era of automotive transformation and chart a path to an electrified future.
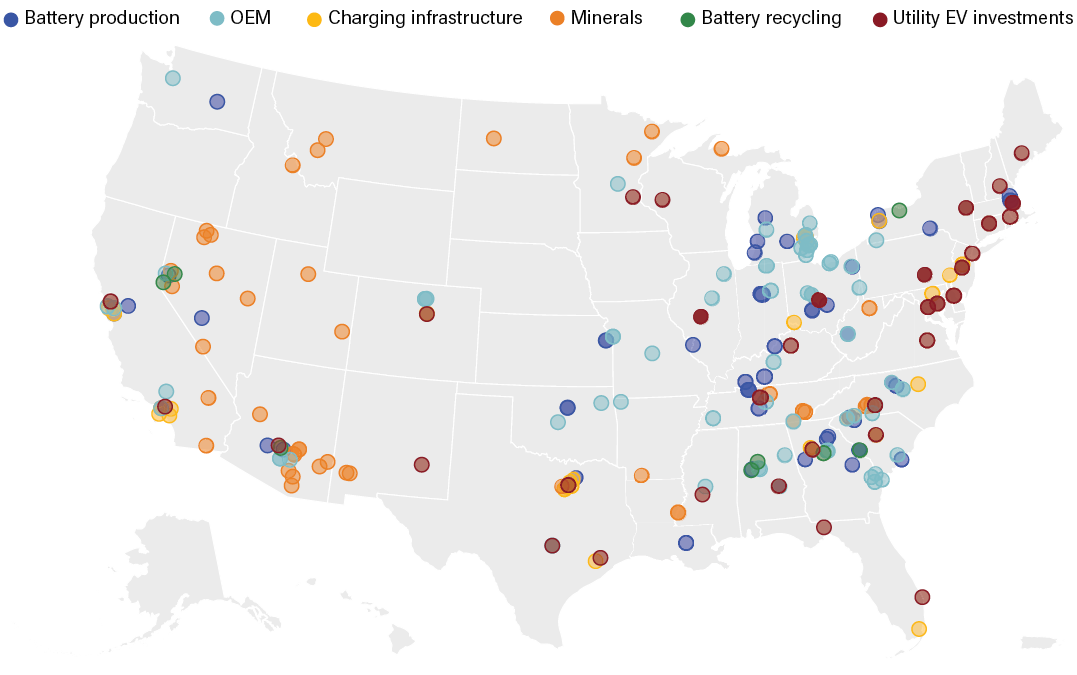
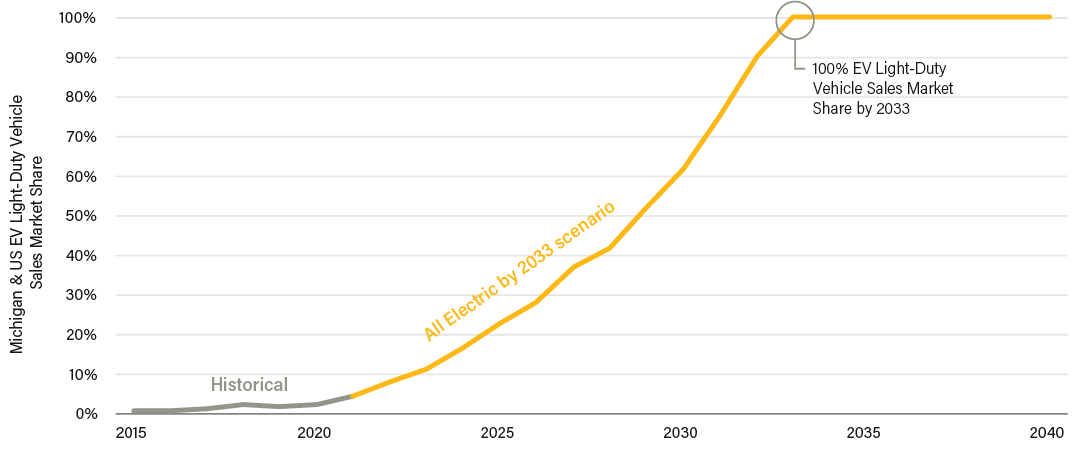
The EV transition is already under way. Sales of new EVs are growing exponentially in the United States. At the same time, recent federal laws have spurred the buildout of charging infrastructure while also promising long-term support for producers and consumers investing in EVs and their supply chains. These measures have invigorated domestic manufacturing and set up the country for growth across industries from battery recycling to semiconductor manufacturing.
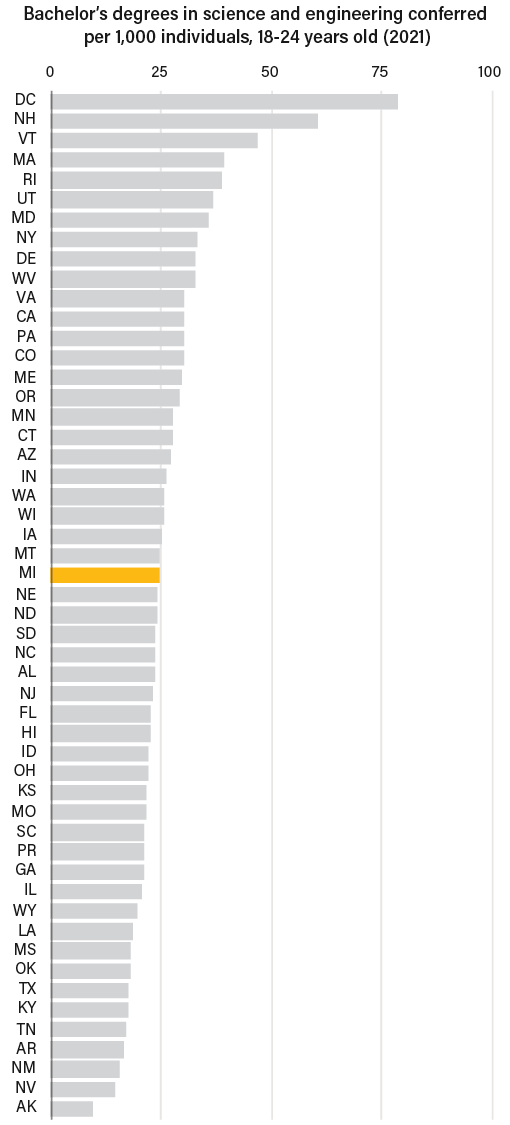
At the same time, the benefits of EV growth in the United States will be hollow if states race to attract industry without consideration for impacts on workers and communities. Shifts in automotive production, fueling, and maintenance processes will change where and how people work. Workers and communities will need sustained, timely and targeted support. Investing in education and public infrastructure would allow states to train and retain the talented people they need. States can invest in future industries by investing in workers and creating structures for employers to do the same.
This report assesses the employment impacts, needs, and opportunities that will likely emerge over the course of the EV transition in Michigan. Looking over a decade into the future, it spotlights auto manufacturing but also evaluates the effects of an expanded EV value chain, taking into account the voice of key local stakeholders in building a policy roadmap.
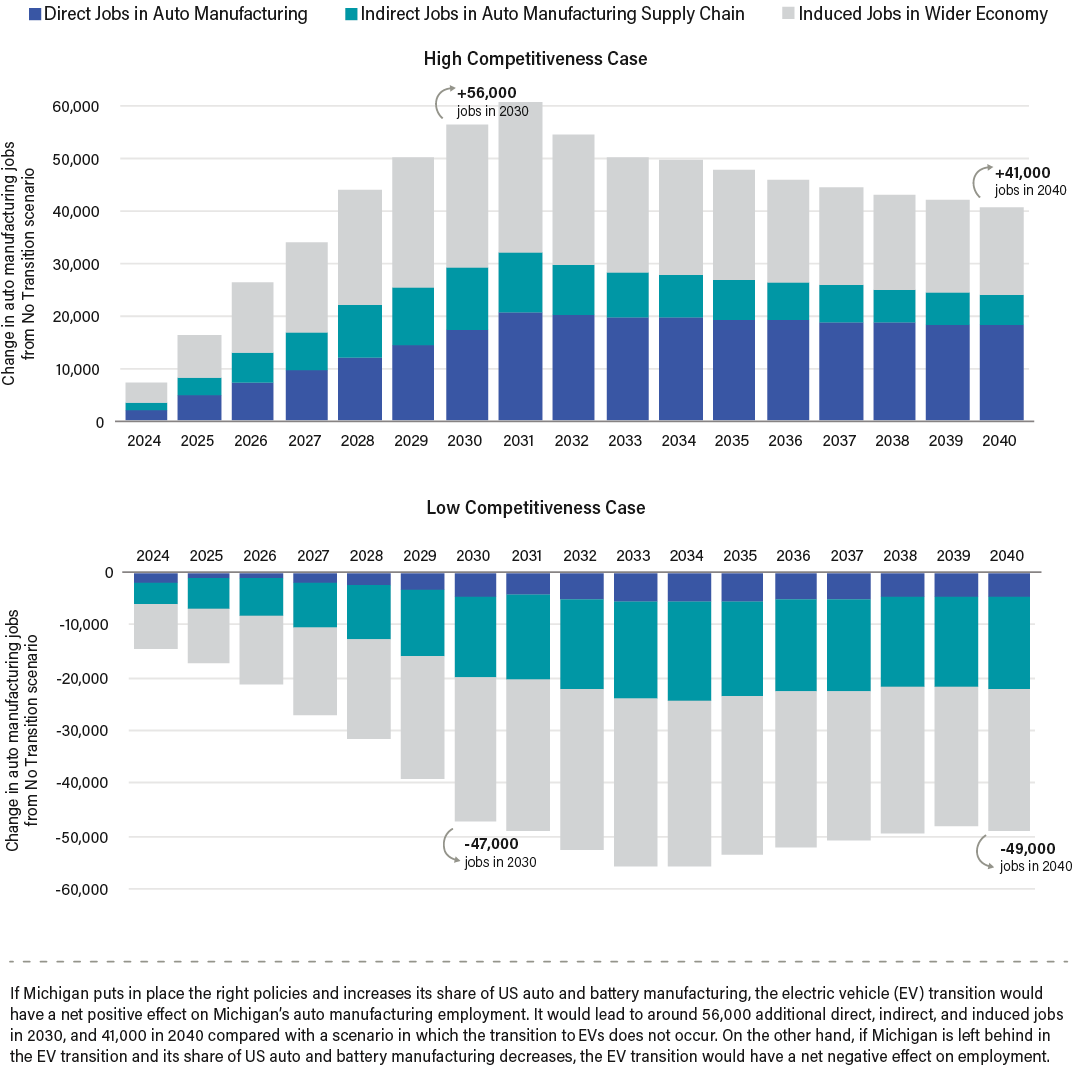
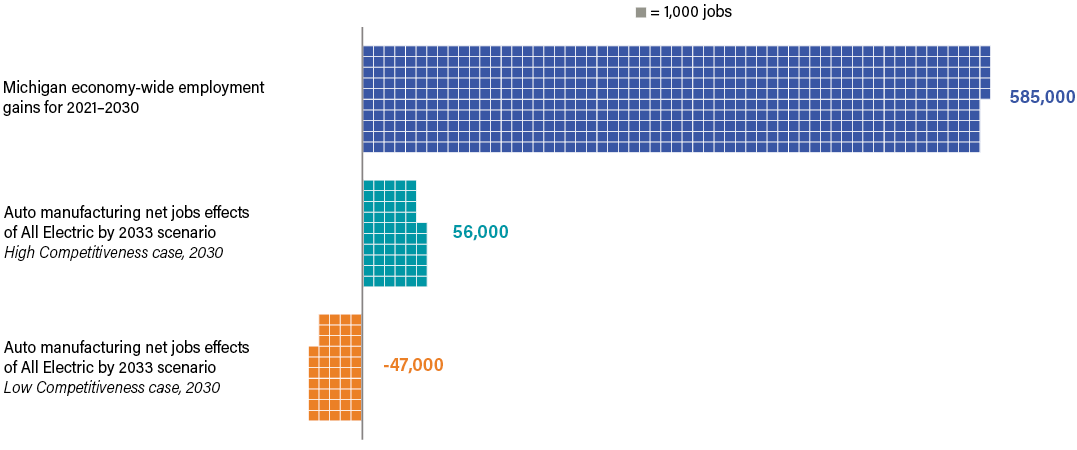
If Michigan seizes the opportunities the transition presents, it stands to gain tens of thousands of high-quality jobs. The state can also realize energy independence, billions of dollars in household savings, and improvements to health and air quality —developments where low-income communities and communities of color stand to benefit the most. Or else, the transition could leave behind longtime autoworkers and communities or even see a broader decline in auto manufacturing jobs.
Michigan has already begun to position itself as a leader in the production and deployment of EVs, establishing a goal to deploy enough charging infrastructure to support 2 million EVs on the roads by 2030. The EV transition has the potential to bring renewed prosperity to the state, occurring in a way that redresses rather than reinforces inequities. As the global just transition movement accelerates, Michigan’s automotive industry is in a unique position to show the United States how to navigate this critical juncture in a way that strengthens communities, economies, and the climate.

Ani Dasgupta
President & CEO
World Resources Institute