report

A roadmap for Michigan’s electric vehicle future

An assessment of the employment effects and just transition needs

Download PDF

Appendices

Appendix A: EV-related programs and efforts in Michigan

Table A-1 | List of Michigan’s existing EV-related programs and efforts

Program

Description

Lead state agency

Category

Alternative Fuel Development Property Tax Exemptiona

Offers tax exemptions for industrial properties that are used for high-technology activities, including those related to advancing electric, hybrid electric, and alternative fuel vehicle technologies

Michigan State Tax Commission

Economic development

Charge Up Michiganb

Provides funding for qualified direct-current fast-charger EV charging equipment, site preparation, equipment installation, networking fees, and signage

EGLE

EV adoption/charging

Connected and autonomous vehicle corridor by Cavnuec

A first-of-its-kind corridor for connected and autonomous vehicles between Ann Arbor and Detroit

MDOT

EV adoption/charging

Council on Climate Solutionsd

An advisory body, created via Executive Order 2020-182, to advise the governor’s office and EGLE on the implementation of climate solutions

Governor, EGLE

Community needs

Critical Industry Programe

Provides investments to businesses to create or retain jobs resulting from a technological shift in product or production

MEDC on behalf of Michigan Strategic Fund

Workforce/education, community needs

Cross-Border Mobility Technologiesf

A partnership with Ontario, Canada, to create a test bed for new technologies to spur innovation and transportation solutions

MDOT and OFME, along with Ontario’s government

Economic development

Detroit Smart Parking Labg

A physical parking structure offering a place for real-world testing of parking-related mobility technologies, logistics, and EV charging

OFME

EV adoption/charging

Emerging Technologies Fundh

Designed to expand funding opportunities for technology-based companies working on innovative research and development

MEDC

Economic development

Fuel Transformation Programi

Offers grants for eligible on- and off-road medium- and heavy-duty vehicles and equipment that reduce nitrogen oxide emissions, improve air quality, and increase adoption of zero-emission or alternative-fuel vehicles and equipment

EGLE

EV adoption/charging

Inductive Vehicle Charging Pilotj

A pilot program to deploy an electrified roadway system that allows vehicles to charge while driving; Electreon was chosen by the state to build an electric road system in Detroit

MDOT and OFME

EV adoption/charging

Lake Michigan Electric Vehicle Circuitk

Collaboration among Illinois, Indiana, Michigan, and Wisconsin to build chargers along more than 1,100 miles around Lake Michigan

Michigan, along with other states

EV adoption/charging

MI Future Mobility Planl

A plan that coordinates efforts across multiple state agencies to address challenges and support the growth of Michigan’s mobility and electrification industry

Developed by OFME, CFME, and other Michigan partners

EV adoption/charging, economic development, community needs

Michigan Central Innovation Districtm

A partnership among the city of Detroit, Ford, and Google to identify solutions with community members to attract and retain talent and high-growth companies while supporting the development of neighborhoods

OFME, MEDC, and other state departments

Workforce/education, community needs

Michigan Alliance for Greater Mobility Advancementn

Established by the Workforce Development Agency, an employer-led collaborative created to develop skills training programs and build a robust EV talent pipeline

LEO

Workforce/education

Michigan Council on Future Mobility and Electrificationo

Established within LEO in 2020 to replace the Council on Future Mobility to advise LEO and OFME

LEO

Economic development

Michigan Healthy Climate Planp

A statewide plan that lays out a vision for achieving economy-wide carbon neutrality by 2050

EGLE

Economic development

Michigan Learning and Education Advancement Programq

A program that provides education and training programs to help job seekers transition to high-skill, high-wage employment opportunities

LEO

Workforce/education

Michigan Mobility Funding Platformr

A program to provide grants to mobility and electrification companies to deploy their technology solutions

MDOT and OFME

Economic development

Michigan Reconnects

Provides tuition assistance toward earning an associate’s degree or a skills certificate for people over 25

LEO

Workforce/education

Michigan STEM Forward internship programt

A program that places STEM students in Michigan’s colleges into internships with leading companies

MEDC

Workforce/education

Mobility Talent Action Teamu

Program focused on delivering professional development programs that engage workers in improving their skills and competencies in line with in-demand roles

MEDC

Workforce/education

Office of Future Mobility and Electrificationv

Established the OFME to support mobility and EV growth across state government, academia, and private industry

OFME

Economic development

Pure Michigan Talent Connectw

An online marketplace connecting Michigan’s job seekers and employers

MEDC, Workforce Development Agency, Talent Investment Agency

Workforce/education

Regional Electric Vehicle (REV) Midwest Coalitionx

Illinois, Indiana, Michigan, Minnesota, and Wisconsin signed the REV Midwest memorandum of understanding to accelerate vehicle electrification in the Midwest

Michigan, along with other states

EV adoption/charging

Regional Talent Innovation Grantsy

A program providing grants to organizations providing training programs in specific occupations that are in high demand at regional employers

MEDC

Workforce/education

Semiconductor Career and Apprenticeship Networkz

A program to strengthen the state’s semiconductor workforce

MEDC

Workforce/education

Sixty by 30aa

A state goal of increasing workforce and education programs, ensuring that 60% of working-age adults have a college degree or skill certificate by 2030

LEO

Workforce/education

Strategic Outreach and Attraction Reserve Fund (SOAR Fund)ab

Over $1 billion to support economic development and site development statewide through grants, strategic site improvement, remediation, and redevelopment for future projects

MEDC

Economic development, just transition/community needs

Strategic Site Readiness Programac

Provides financial incentives such as access to grants, loans, and other economic assistance to eligible applicants to create investment-ready sites

MEDC on behalf of Michigan Strategic Fund

Economic development

Transportation and Civil Engineering Programad

Connects high school and middle school students with transportation- and civil engineering–related jobs

MDOT

Workforce/education

Transformational education projectae

Invested $130 million to focus on research, development, and educational pathways for the future of mobility and electrification

Governor

Workforce/education

Note: EV = electric vehicle; EGLE = Department of Environment, Great Lakes, and Energy; MDOT = Michigan Department of Transportation; MEDC = Michigan Economic Development Corporation; OFME = Office of Future Mobility and Electrification; CFME = Council on Future Mobility and Electrification; LEO = Department of Labor and Economic Opportunity; STEM = science, technology, engineering, and mathematics.

Sources: a. DOE n.d.e; b. EGLE n.d.b; c. Cavnue n.d.; d. EGLE n.d.a; e. MEDC 2022a; f. OOTG 2021c; g. MEDC 2021; h. MSBDC 2017; i. EGLE n.d.c; j. MEDC 2022b; k. OOTG 2022c; l. OFME 2022; m. Michigan Central 2021; n. MAGMA n.d.; o. OOTG n.d.; p. EGLE 2022; q. LEO n.d.b; r. MEDC n.d.a; s. LEO n.d.a; t. Ann Arbor SPARK n.d.; u. OOTG 2022b; v. MEDC n.d.b; w. LEO n.d.c; x. DOE 2021; y. MEDC n.d.c; z. OOTG 2022a; aa. LEO n.d.d; ab. OOTG 2021b; ac. MEDC 2023; ad. MDOT 2022; ae. OOTG 2022d.

Appendix B: Provisions in the Infrastructure Investment and Jobs Act, Inflation Reduction Act, and CHIPS and Science Act for accelerating EV deployment

Table B-1 | Provisions in US legislation that accelerate EV deployment

Program name

Funding amount

Program description

The Infrastructure Investment and Jobs Act contains significant funding for accelerating transportation electrification. It primarily does so by addressing barriers to the widespread adoption of EVs; namely, the need for a rapid build-out of EV charging infrastructure.a

National Electric Vehicle Infrastructure Formula Program

$5 billion between FY2022 and FY2026

The program provides dedicated funding to states to build out a national network of EV charging stations, primarily along interstate highways. Funds can also be used to add charging capacity on any public road or in other publicly accessible community locations once the national network is built out. Funding can be used by states both for the acquisition and installation of EV infrastructure and their operation and maintenance. States were required to submit an EV Infrastructure Deployment Plan to the Joint Office of Energy and Transportation by August 1, 2022.

Charging and Fueling Infrastructure Discretionary Grant Program

$2.5 billion between FY2022 and FY2026

Funding is to be divided equally between corridor charging along designated alternative fuel corridors and community charging in other locations with an emphasis on rural and underserved communities. Funding is directed toward states, local governments, metropolitan planning organizations, and other public sector entities. Guidelines are being developed, and the Federal Highway Administration established the program with applications due by May 30, 2023.

Clean School Bus Program

$5 billion between FY2022 and FY2026

The program provides funding to replace existing school buses with zero-emission and low-emission buses. In most cases, funding will be awarded directly to school districts. The first funding opportunity under this program is the 2022 Clean School Bus Rebates with the EPA offering $500 million for zero-emission and low-emission school buses.

Battery Material Processing Grant Program

$3 billion between FY2022 and FY2026

Administered by the Department of Energy’s Office of Fossil Energy and Carbon Management, this program will fund demonstration projects and the construction of facilities for processing battery materials.

Battery Manufacturing and Recycling Grants Program

$3 billion between FY2022 and FY2026

Administered by the Department of Energy’s Office of Energy Efficiency and Renewable Energy, this program will fund demonstration projects and the construction of facilities for advanced battery component manufacturing, advanced battery manufacturing, and recycling.

The Inflation Reduction Act takes significant steps to accelerate vehicle electrification by providing incentives to spur greater adoption of EVs and promoting domestic manufacturing of zero-emission vehicles. Key provisions are listed below under two categories—tax credits and domestic manufacturing investments.b

Section 30D tax credit for new EVs

$7.5 billion until December 2032

The provision provides up to $7,500 in consumer tax credit. The credit amount is divided equally such that a vehicle will qualify for a $3,750 tax credit if it meets a “critical materials” requirement and another $3,750 if it meets a “battery component” requirement. The critical materials requirement provides that a specified portion of the materials contained in the battery must be extracted or processed in a country with which the United States has a free trade agreement or that the materials be recycled in North America. This requirement starts at 40% and increases to 80% after 2026. The battery component requires that a specified portion of the components must be manufactured or assembled in North America. This requirement starts at 50% and increases to 100% after 2028. Vehicles in which the critical materials or components of a battery are sourced from a “foreign entity of concern” (e.g., an entity owned or controlled by the government of China or Russia) are not eligible. The final assembly of vehicles should be in North America. Taxpayers are permitted to transfer the credit to the dealer from which the vehicle has been purchased if the dealer has been registered with the Secretary of the Treasury and meets other requirements. This will enable buyers to receive the credit as a rebate at the point of sale. Price caps have been set for qualifying vehicles and modified adjusted gross income limitations placed on eligible taxpayers. (Van/SUV/pickup truck threshold is $80,000, others $55,000; income limitation for joint returns = $300,000, head of household = $225,000, other = $150,000).

Section 25E tax credit for used EVs

$1.4 billion until December 2032

The provision provides up to $4,000 in consumer tax credit. Buyers can qualify for a credit that is the lesser of $4,000 or 30% of the sales price for used EVs weighing less than 14,000 lbs. The sales price of a qualified used EV cannot exceed $25,000, and the vehicle must be at least two years old. There are income caps for eligibility (single = $75,000, head of household = $112,500, joint filing = $150,000).

Section 45W tax credit for commercial EVs

$3.6 billion until December 2032

The tax credit provides up to $7,500 for vehicles with a gross vehicle weight rating (GVWR) of less than 14,000 lbs., and up to $40,000 for vehicles with a GVWR of more than 14,000 lbs.

The eligible credit amount per qualified commercial EV is the lesser of 30% of the sales price or the incremental cost of the vehicle. The incremental cost is defined as the difference between the purchase price of the EV and that of a comparable internal combustion engine vehicle. There are no battery or mineral sourcing requirements under Section 45W. Direct pay is available for non-taxable entities.

Section 30C alternative refueling property credit

$1.7 billion until December 2032

The provision provides up to 30% of the cost of a “qualified alternative fuel vehicle refueling” station, subject to a limit of $100,000 per station. The tax credit starts at a 6% baseline, with the full 30% available only if certain prevailing wage and apprenticeship requirements are met. Credits are also restricted to locations in low-income communities and census tracts that are “not an urban area.” Residential consumers who purchase residential refueling equipment may receive a tax credit of up to $1,000.

Advanced Manufacturing Production Tax Credit

$30.6 billion until December 2032

The tax credit provides $35/kWh of capacity for battery cells and $10/kWh for makers of battery modules.

Domestic Manufacturing Conversion Grant Program

$2 billion through 2031

Grants are provided to retool existing auto manufacturing facilities to produce clean vehicles, including hybrids, plug-in hybrids, EVs, and hydrogen fuel cell vehicles.

Advanced Technology Vehicle Manufacturing Loan Program

$3 billion

The DOE Loan Programs Office will provide direct loans for re-equipping, expanding, or establishing manufacturing facilities for making low- or no-emission vehicles and their components.

Section 48C Advanced Energy Project Investment Tax Credit

$10 billion—energy storage technology projects starting construction before December 31, 2024, are eligible

Factory owners apply to the IRS for tax credits worth up to 30% of the project value, with the full credit value available to those meeting prevailing wage and apprenticeship standards, and bonuses for projects located in energy communities. Forty percent of the funds are earmarked for projects in these communities.

Clean Heavy-Duty Vehicle Program

$1 billion through 2031

The EPA will offer grants and rebates to eligible participants to replace existing class 6 and 7 heavy-duty vehicles with zero-emission vehicles. From this funding, $400 million is earmarked for communities in nonattainment areas.

The CHIPS Act includes several billion dollars for semiconductor research, development, and manufacturing, including dedicated funding set aside for chips used in automobiles.c

Section 48D Advanced Manufacturing Investment Credit

$24 billion until December 2026

The provision provides a 25% investment tax credit for investments in manufacturing of semiconductors and related equipment. The tax credit is eligible for direct pay option.

CHIPS Fund

$50 billion over five years

Funding is provided over five years to build, expand, or modernize domestic facilities and equipment for semiconductor fabrication, assembly, testing, advanced packaging, or research and development; $2 billion is devoted to legacy chip production in the auto industry and the military.

CHIPS for America Workforce and Education Fund

$200 million over five years

Funding is provided to the National Science Foundation to promote the development of the domestic semiconductor workforce.

Note: FY = fiscal year; EPA = Environmental Protection Agency; SUV = sport utility vehicle; lbs. = pounds; IRS = Internal Revenue Service.

Sources: a. US Congress 2021; b. US Congress 2022b; c. US Congress 2022a.

Appendix C: Modeling assumptions and methodology

Approach

Our analysis in this paper modeled the employment impact of the EV transition between 2024 and 2040, focusing on light-duty passenger vehicles. WRI developed the assumptions for this analysis in partnership with John A. “Skip” Laitner of Economic and Human Dimensions Research Associates, who also conducted the economic modeling.

The analysis relies on the DEEPER model, which is a quasi-
dynamic linear programming model. DEEPER takes patterns of spending across time and matches them with coefficients based on IMPLAN, an input-output model grounded in data from the US Bureau of Economic Analysis, to determine a final net spending pattern for the Michigan economy and the jobs that translates to. It has been widely used and was the foundational model for the American Council for an Energy-
Efficient Economy.

While data on Michigan’s present day economic activity are geographically specific, it is important to note that projections of future activity cannot be interpreted as geographically bound. The estimates we present reflect the Michigan employment associated with the vehicle electrification and competitiveness scenarios we define assuming current state-level geographic patterns of corporate spending hold constant. Actual employment could differ if firms change where they locate specific operations, or even where they purchase inputs.

Electric vehicle sales scenarios

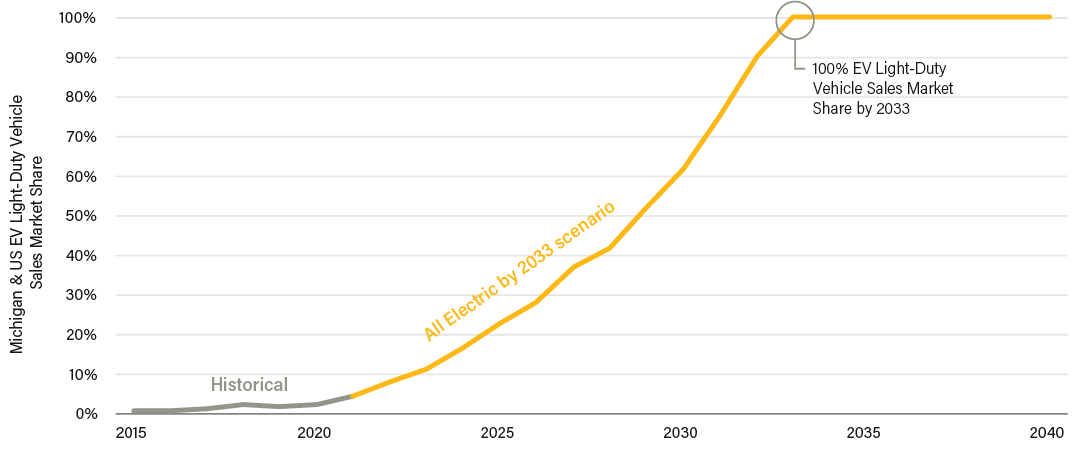
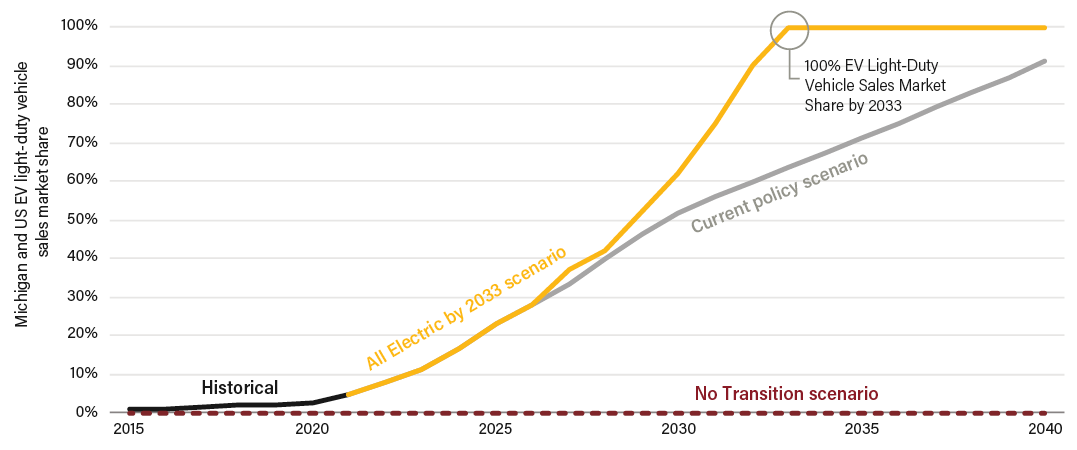
For our analysis, we modeled three scenarios of EV update: an All Electric by 2033 scenario, a Current Policy scenario (not presented in the full report), and a No Transition reference scenario (Figure C-1). These scenarios refer to EV LDV sales penetration for both Michigan and the United States as a whole.

In 2021, EVs reached 4.7 percent of vehicle sales in the United States. In our Current Policy scenario, EVs reach around 50 percent of LDV sales in 2030 and around 90 percent of sales in 2040. This was derived from the Economic Transition scenario from BloombergNEF (BNEF), which assumes that US EV sales are primarily driven by technological and economic trends, and that no new policies or regulations are enacted that impact the market. BNEF’s latest update of its Economic Transition scenario (BNEF 2022b) accounts for the impacts of the Inflation Reduction Act, but it goes only to 2030. Therefore, we extrapolated past 2030 by using the average growth rate for 2030–40 from a prior version of the analysis (BNEF 2022a), simply adjusting the 2030 starting point upwards based on the new pre-2030 analysis.

In our All Electric by 2033 scenario, EVs reach around 60 percent of LDV sales in 2030 and 100 percent of sales by 2033. This was derived from BNEF’s Net Zero scenario, which investigates what it would take to reach net-zero emissions for the road transport sector in the United States (BNEF 2022a). We adjusted BNEF’s Net Zero scenario for the years prior to 2027 to ensure that the All Electric by 2033 scenario was not lower than the current policy scenario.

Note that in BNEF’s scenarios EVs include battery electric vehicles (BEVs), plug-in hybrid vehicles, and fuel cell electric vehicles. BNEF does not provide a breakdown for the United States, but globally it forecasts that BEVs will dominate, making up 88 percent of these types of sales in 2030 and 97 percent in 2040. In our scenarios, we assumed that all the EV sales will be BEVs. This greatly simplified the modeling needed, and we feel it is appropriate given that automakers are primarily focused on expanding their lines of BEVs and the majority of EV sales are expected to be BEVs in the coming decades. Therefore, when we use the term “electric vehicle” in this publication, we are referring only to BEVs.

Finally, we also modeled a No Transition reference scenario in which no EVs are sold, only ICE vehicles. We measured the employment impacts of the other two scenarios in comparison to this No Transition scenario, thereby isolating the effects of the transition to EVs from other trends. For example, our modeling assumes that labor productivity gains will continue to reduce the number of jobs needed per unit of output across the entire economy, including for both EVs and ICE vehicles. By using a No Transition scenario, we controlled for this effect. An important note is that this No Transition scenario is not a business-as-usual scenario, and it is not something that is remotely realistic. If Michigan continued to buy and produce only ICE vehicles, it would be left behind as the rest of the world pivots to EVs, very likely losing substantial market share. The continued use of ICE vehicles would also contribute to climate damages. The No Transition scenario is simply included to give a sense of the scale of the employment transition that is needed.

Figure C-1 | EV sales modeling scenarios

Note: EV = electric vehicle.

Source: Authors, based on BNEF 2022a, BNEF 2022b, and own calculations.

Assumptions and sensitivities

For each EV sales scenario, we developed assumptions around the amount of expenditure in the various auto-related sectors of Michigan’s economy.

For the following sectors, we divided the expenditures into how much would go into EV-related expenditures versus how much would go to ICE vehicle–related expenditures in each scenario.

  • Auto manufacturing: Everything except batteries (expenditures on EV production versus ICE vehicle production)
  • Fuel (expenditures on gasoline versus electricity)
  • Maintenance and repair (expenditures on EV maintenance and repair versus ICE vehicle maintenance and repair)
  • Auto financing (expenditures on EV financing versus ICE vehicle financing)
  • Insurance and fees (expenditures on EV insurance and fees versus ICE vehicle insurance and fees)
  • Re-spending of savings from vehicle ownership (depends on whether EVs or ICE vehicles are cheaper)

For other sectors, we looked only at expenditures relevant to EVs in each scenario, because there is no ICE vehicle equivalent:

  • Battery manufacturing
  • EV charging infrastructure

Auto manufacturing expenditures: Everything except batteries

We arrived at our assumptions for auto manufacturing expenditures (except batteries) by multiplying the cost of vehicles for each type of powertrain and segment by the number of vehicles manufactured in Michigan and then making adjustments to compensate for the changed composition of EVs compared with ICE vehicles.

Our definition of the automotive sector includes the full value chain of electric vehicles, with battery manufacturing representing a new and critical part. However, given the salience of battery manufacturing in a changing auto industry and due to modeling constraints, employment in battery manufacturing was estimated separately from automotive manufacturing, and the battery materials supply chain was not included.

Vehicle costs:

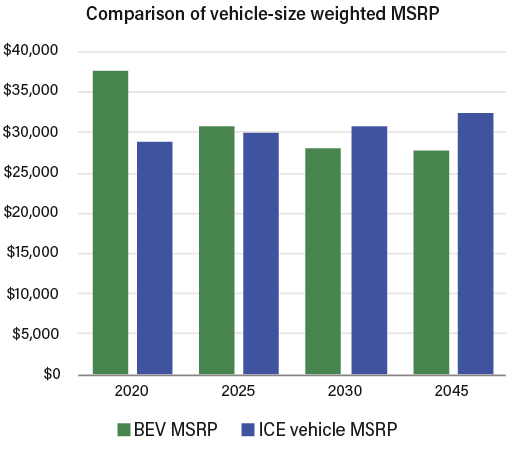
We used Argonne National Lab’s BEAN tool to form our assumptions about EV and ICE vehicle manufacturing costs (ANL 2022). We used the BEAN tool’s vehicle manufacturing price outputs to estimate the cost of EVs and ICE vehicles in 2025, 2030, and 2045 by car segment (compact, midsize, small SUV, midsize SUV, pickup). These prices were based on the BEAN tool’s medium technology progress scenario, which assumes a medium level of progress in efficiency for powertrain technologies. Instead of using the BEAN tool’s default battery costs for 2025 and 2030, we substituted in EV battery cost projections from BNEF (2022a): $85 per kilowatt-hour in 2025 and $59 per kilowatt-hour in 2030. BNEF’s data extends only to 2035 so to arrive at the 2045 input for the BEAN tool we assumed that the ratio between the BNEF battery cost estimates and the BEAN tool battery cost estimates in 2045 is the same as it was in 2035, arriving at an assumption of $34 per kilowatt-hour in 2045. We assumed that EVs have a 300-mile range in 2025 and 2030 and a 400-mile range in 2045. Using these assumptions in the BEAN tool, EVs are less expensive than ICE vehicles for compact and midsize cars in 2025, and they are less expensive for all vehicle segments in 2030 and after. The BEAN tool provides vehicle costs only for 2025, 2030, and 2045, so we interpolated vehicle costs for the years in between. As we did not include sales of used cars in our modeling, the resale values of vehicles were not included. See Figure C-2.

Figure C-2 | Vehicle cost assumptions

Note: MSRP = manufacturer’s suggested retail price; BEV = battery electric vehicle; ICE = internal combustion engine.

Sources: ANL 2022; BNEF 2022a; authors.

Quantity of vehicles manufactured in Michigan:

The starting point of our calculations was to consider the total number of vehicles projected to be sold in the United States (BNEF 2022a).

For ICE vehicles, we assumed that 52 percent of LDVs sold within the United States will be manufactured in the United States, keeping the share the same as it was for all vehicles in 2017 (Schultz et al. 2019).

For EVs, we assumed that the Inflation Reduction Act’s tax incentives successfully onshore more EV manufacturing. For companies to access IRA tax credits, final assembly of EVs has to take place in North America, effective immediately. Final assembly is expected to be in North America for 76 percent of US EV sales in 2022–23 (BNEF 2022b). We assumed that over the next five years that share increases steadily, reaching 100 percent of final assembly taking place in North America in 2028. However, the United States will likely not make up all North American EV manufacturing. For example, of the LDVs purchased in the United States in 2017, 52 percent were US-produced, 14 percent were Mexico-produced, 11 percent were Canada-produced, and 23 percent were produced elsewhere (Schultz et al. 2019). In a situation where final assembly takes place only in North America, we assumed the breakdown would be 68 percent US-produced, 18 percent Mexico-produced, and 14 percent Canada-produced.

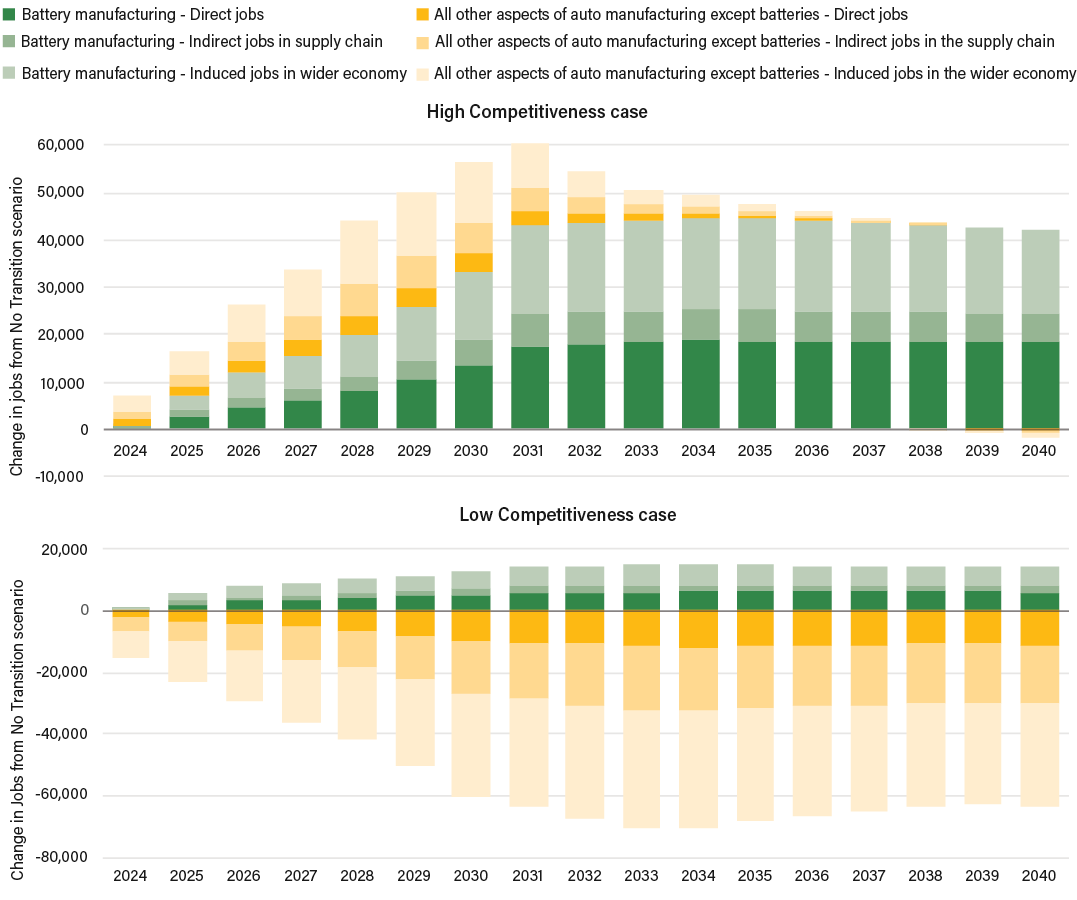
The next step was to determine what share of the US vehicle manufacturing market will be taken up by Michigan. Since 2009, Michigan’s share of US vehicle production has fluctuated from roughly 17 percent to 24 percent (Dziczek 2022). In the No Transition scenario, we assumed that 20 percent of US vehicle production is manufactured in Michigan throughout the study period. For the Current Policy and All Electric by 2033 scenarios, we adjusted this depending on the case. In our High Competitiveness case we assumed Michigan’s share starts at 20 percent and increases to 25 percent in 2030, staying at that level thereafter. This is an optimistic assumption and would require Michigan to seize the opportunity with EVs to gain market share. Therefore, we also included a Low Competitiveness case in which Michigan’s share starts at 20 percent of US production and then declines to 15 percent in 2030, staying at that level thereafter.

We focused on domestic sales, not including the value of motor vehicles and parts that Michigan exports, which totaled about $16 billion in 2020 (GlobalEdge and MSU 2020). As those exports go mostly to Canada, which has a 2035 zero-emission target for LDVs, we would expect the inclusion of exports to only accentuate the trends seen in our results for auto manufacturing, though not for sectors based on the number of EVs sold in Michigan.

We weighted Michigan’s vehicle manufacturing and purchases to reflect 2020 market shares of vehicle segments, holding those constant through 2040. However, the vehicle segments that we used to calculate costs in the BEAN tool (compact, midsize, small SUV, midsize SUV, pickup) did not align with the vehicle segments used to project sales from BNEF (small, medium, large, SUVs). We needed to match these to calculate total expenditures on vehicle manufacturing, so we translated the BNEF segment sales numbers into percentages and then aligned those to the BEAN categories. We translated sales of small to compact, medium to midsize, large to pickup, and split SUVs evenly into small SUVs and midsize SUVs.

To calculate how many vehicles Michigan will manufacture in each segment, we multiplied the percentage of vehicles sold in each segment by the number of US sales of vehicles manufactured in Michigan. We assumed that the breakdown of segments of vehicles that Michigan manufactures is identical to the national breakdown. For each segment, we distributed the number of vehicles manufactured in Michigan between EVs and ICE vehicles based on our scenarios and previously described assumptions. We assumed that the share of vehicles that are EVs versus ICE vehicles in a given year is the same across each segment.

Labor intensity adjustments

EVs are less complex and have fewer moving parts than ICE vehicles, which is expected to make them easier to assemble. It is difficult to know for certain what the labor comparison will be given that the EV industry is still relatively new, but we wanted to account for this expected change. Ford and Volkswagen have both estimated that EV manufacturing will require 30 percent less labor (Hackett 2017; Fraunhofer IAO 2020), and we validated the estimate in our stakeholder consultations. Therefore, in the modeling we modified our job multipliers for all aspects of auto manufacturing excluding batteries to reflect that EVs require 30 percent less labor to manufacture than ICE vehicles. Other studies use similar assumptions (Barrett and Bivens 2021).

Some studies find that there is no difference between labor for EVs and that for ICE vehicles (Küpper et al. 2020; Cotterman 2022), but these studies take into account that the decrease in labor for vehicle manufacturing is made up for by the increase in labor for battery manufacturing. In our analysis, we considered vehicle and battery manufacturing separately, which is why we applied this assumption of 30 percent less labor than ICE vehicle manufacturing to the EV manufacturing side of our analysis. We are not experts in the auto manufacturing process, but we have validated this assumption with stakeholders throughout Michigan. There is not a consensus given that electric vehicles are an evolving technology, but this is a working assumption. We kept the value constant at 30 percent for simplicity, but it could be that the relative labor intensity of EV production to ICE vehicle production changes over time as the EV industry develops.

Transport, wholesale, and dealership jobs

Our modeling in DEEPER for all aspects of auto manufacturing except for batteries encompassed not only manufacturing but also the transport, wholesale, and retail dealership jobs that go along with manufacturing. Our modeling applied a simple ratio to the changes in manufacturing expenditures to determine the effect on transport, wholesale, and retail dealerships based on their past economic relationship. We did not add any specific assumptions about how the shift to EVs will change these types of jobs beyond changing expenditures in the overall manufacturing sector, though direct sales models embraced first by Tesla and now by Ford could change industry dynamics.

Battery manufacturing expenditures

EV batteries represent a significant portion of the automotive value chain and are not fully accounted for in historical automotive manufacturing data, which primarily reflect the production process of ICE vehicles. To better reflect total vehicle manufacturing costs, the total costs of EV batteries were modeled separately.

We first estimated the total value of all EV batteries sold in the United States in each scenario in a given year. We did this using the same battery cost assumptions per segment and BEAN tool battery cost outputs as described in the previous section, multiplied times the number of EVs sold in the United States in each segment for each scenario. This means that our battery costs reflect EV batteries that vary by vehicle size, go from a 300-mile range in 2025 and 2030 to a 400-mile range in 2045, and consider the changing price per kilowatt-hour from BNEF, as well as updates to vehicle efficiency embedded in the BEAN tool. We did not include battery exports.

The next step was to determine how much of the total value of all EV batteries sold in the United States would be captured domestically, and by Michigan in particular.

First, to determine the number of batteries sold in the United States that are produced domestically, we considered the requirements of the Inflation Reduction Act. The IRA aims to vastly increase the amount of EV batteries produced domestically. The IRA bifurcates the $7,500 consumer tax credit amount so that a vehicle will qualify for a $3,750 tax credit if it meets a “critical materials” requirement and another $3,750 if it meets a “battery component” requirement. The critical materials requirement provides that a specified portion of the materials contained in the battery must be extracted or processed in a country with which the United States has a free trade agreement or that they be recycled in North America. This requirement starts at 40 percent and increases to 80 percent after 2026. The battery component requires that a specified portion of the components must be manufactured or assembled in North America. This requirement starts at 50 percent and increases to 100 percent after 2028. The value chain of EV batteries is complex and changing quickly, and the exact ways in which these domestic content provisions of the IRA will be administered and enforced is yet to be determined, so understanding the full impact is difficult.

To understand what the impact of the IRA’s battery component requirement could be, we assumed all vehicles sold in the United States fully meet the IRA’s domestic content requirements for batteries to access the tax credits. This is likely possible because there have been enough announcements of planned lithium-ion battery plants in North America to meet expected US EV demand in 2030 (BNEF 2022b), and there will presumably be more announcements in the future. Based on our research, the United States is expected to make up 85 percent of North American battery capacity—the United States has approximately 700 gigawatt-hours (GWh) of battery production announced for 2030 (BMI 2022); Canada has approximately 120 GWh of battery production announced for 2030 (Gisbert and Careaga 2022); there is no announced battery capacity in Mexico yet. Applying this ratio to the IRA requirements, we assumed that 43 percent of EV battery production will be in the United States in 2023, rising to 85 percent in 2029. The IRA provisions are set to expire after 2032, but we assumed that 85 percent of EV batteries will continue to be produced in the United States.

The second step was to determine what proportion of the US EV battery value chain is captured by Michigan. In 2021, Michigan manufactured 9.7 percent of US batteries, according to Benchmark Mineral Intelligence with updates by Our Next Energy (BMI 2022). In our reference scenario, Michigan manufactures 10 percent of US batteries throughout the time period. In the Current Policy and All Electric by 2033 scenarios we adjusted this depending on the case. For the High Competitiveness case, we assumed that Michigan begins by manufacturing 10 percent of US batteries today, but this rises to 15 percent by 2030 and stays at 15 percent thereafter. This is an optimistic assumption, so we also modeled a Low Competitiveness case in which Michigan begins by manufacturing 10 percent of US batteries today, but this falls to 5 percent by 2030 and stays at 5 percent thereafter.

Total cost of ownership (TCO)

While manufacturing expenditures depend on the number of vehicles sold by Michigan plants, TCO expenditures depend on the number of vehicles purchased by Michigan households, firms, and others. We assumed that 2.78 percent of vehicles sold in the United States end up in Michigan based on the average percentage of LDVs in the United States that were registered in Michigan from 2015 to 2020 (DOT 2022).

We calculated the TCO for vehicles using the BEAN tool for each powertrain and each car segment in each year, and then added those numbers to find the total TCO. We used the BEAN tool with certain settings adjustments. We adjusted the default price of gasoline and electricity to account for Michigan having prices different than national average prices. We assumed that vehicles will travel 14,000 miles per year at the start, which gradually declines over the vehicles’ lifetimes. We assumed that the MSRP was 40 percent higher than the cost of manufacturing the vehicle based on Bureau of Labor Statistics data. We used the BEAN tool’s medium technology scenario, and a 5 percent discount rate.

Using the tool, we found the costs of financing, fuel or electricity, insurance, taxes and fees, maintenance and repair, and net savings, as well as the other costs provided by the tool for each vehicle type on an annual basis. We then multiplied the total cost of ownership by the total number of EVs and ICE vehicles by segment on Michigan roads per year, assuming vehicles have a 12-year lifetime, to get the total expenditures on TCO.

1. Financing

We used the cost of financing per vehicle found in ANL’s BEAN tool and employed the previously mentioned settings. We assumed 100 percent of vehicle sales are financed at a 4 percent financing rate over a six-year term.

2. Fuel for ICE vehicles (gasoline)

We used the cost of gasoline per vehicle found in ANL’s BEAN tool and employed the previously mentioned settings and the following adjustments.

We projected the price of fuel in Michigan through 2040 by finding the difference between US fuel prices and Michigan fuel prices from 2010 to 2019 using data from the US Energy Information Administration’s State Energy Data System (EIA 2022a). We calculated that difference as a percentage and added that to the projected cost of fuel in the United States for 2025–40 from the EIA Annual Energy Outlook 2022’s Reference scenario to find Michigan-specific costs for each year. These estimates likely underestimate ICE fuel costs, as the EIA projections do not capture effects from the Russian invasion of Ukraine. We used EIA fuel efficiency projections for LDVs to calculate the amount of fuel needed per vehicle on an annual basis.

3. Fuel for EVs (electricity)

We used the cost of electricity per vehicle found in ANL’s BEAN tool and employed the previously mentioned settings and the following adjustments.

We projected the price of electricity in Michigan through 2040 by finding the difference between US electricity prices and Michigan electricity prices from 2010 to 2020 using data from the EIA (EIA 2022a). We calculated that difference as a percentage for both residential and commercial electricity prices and added that to the EIA’s projected cost of electricity in the United States for 2025–40 to find Michigan-specific costs. For residential electricity prices, we assumed an additional discount of 25 percent, as we expect utilities to move to time-of-use charging rates to encourage off-peak charging. This discount is based on the difference between the average rate and the off-peak EV rate charged by Pacific Gas and Electric, the largest utility in the state with the highest rate of EV ownership. Note, we didn’t include it in our modeling, but the Inflation Reduction Act is likely to make electricity prices cheaper for households (O’Boyle et al. 2022).

We assumed that each EV requires 0.32 kilowatt-hours per mile (kWh/mi) of electricity generation and consumes approximately 0.30 kWh/mi of alternating current energy, assuming 4.9 percent system losses for transmission and distribution, based on a calculation from the Department of Energy (DOE 2019). The 4.9 percent is specific to Michigan, using EIA data from 2020, and mirrors the 4.9 percent used nationally by DOE.

Referencing the International Council on Clean Transportation’s estimates that home charging will fall from 78 percent of EV electricity consumption in 2020 to 59 percent by 2030, we assumed that 80 percent of charging will take place at home in 2024, decreasing to 60 percent over time (Bauer et al. 2021). Additionally, to account for decreased battery range during Michigan’s cold winters, we assumed a 40 percent drop in battery efficiency and a corresponding increase in electricity needs for three months of the year.

4. Insurance

We used the default cost of insurance per vehicle found in ANL’s BEAN tool and employed the previously mentioned settings.

5. Taxes and fees

We used the default cost of taxes and fees per vehicle found in ANL’s BEAN tool and adjusted the BEV fee to reflect Michigan’s $140 annual EV fee for non-hybrid vehicles.

6. Maintenance and repair

We used the cost of maintenance and repair per vehicle found in ANL’s BEAN tool and employed the previously mentioned settings. EVs are expected to require less maintenance and repair than ICE vehicles as they are less complex. On average, the BEAN tool has EVs requiring 41 percent lower maintenance and repair costs than ICE vehicles.

7. Net savings

EVs are going to be cheaper to own and operate than ICE vehicles, so consumers will save money. The BEAN tool does not output these savings, so we calculated them ourselves. For every EV, we used the difference between the projected EV and ICE vehicle model MSRP each year, multiplied that by the number of vehicles sold each year, and added that to the savings total. We did the same for total cost of ownership to reflect the savings on fuel and maintenance and repair that accrue to EV owners. For the modeling, we assumed that 100 percent of those savings are re-spent in the rest of the US economy, but only about 65 percent of that is spent in Michigan—consistent with observed consumer spending patterns.

EV charging infrastructure

Using cost estimates derived in Bauer et al. (2021), we assumed that each EV sold in Michigan will require $1,100 in investment in non-home (public and workplace) charging, and $850 invested in at-home charging. Applying these to the 2.78 percent of US vehicles sold in Michigan each year, we arrived at annual estimates for expenditures on construction of electric vehicle supply equipment in Michigan. Based on the finding of Bauer et al. (2021) that public and workplace chargers can support 13 EVs per charger, and data from Argonne National Lab’s EVSE JOBS tool showing that EV charging stations require $55 in operational expenditures per month, we estimated cumulative spending on public EVSE operations throughout the time period, with the assumption that all non-home EV charging stations have a life of 10 years. We assumed replacing non-home EV charging stations costs 10 percent of the original expenditure on the station, consistent with the range provided in Nelder and Rogers (2019).

Key limitations of assumptions

It is challenging to model electric vehicles and battery manufacturing when the industry is so new and still evolving rapidly. Our analysis is intended to provide indicative insights into what the employment impacts of the transition could be, especially to understand the direction of the impacts. The level of uncertainty in our results is high, and the level of precision is low. Especially for results past 2030, there are fewer data points available to form assumptions. Small changes to the assumptions can cause substantial changes in the results. We conducted multiple rounds of modeling to improve our methods. We consider this analysis to be one of the most in-depth modeling exercises of the auto industry and supply chain as it regards the EV transition, but the auto supply chain is incredibly complex and there were numerous data limitations, so we made many simplifying assumptions and educated guesses, as described in the sections above.

There are several types of jobs emerging from the EV transition that we were unable to model due to data or time limitations. These include recycling of EV batteries, upgrades of manufacturing facilities to allow them to produce EVs, and the manufacturing of EV charging equipment. Each of these sectors would increase the number of jobs as a result of the EV transition if the job gains in these sectors were greater than the number of jobs lost in ICE vehicle recycling and manufacturing of gasoline pumps.

Our model does not reflect all expected or potential structural shifts within sectors. In the case of gasoline, the No Transition scenario includes basic assumptions about labor productivity increases based on economic trends but does not account for the fact that many gasoline retail jobs are likely to disappear due to automation regardless of vehicle electrification trends. Our estimates for the automotive sector do not incorporate a shift away from the dominant dealership sales model that is being challenged by the direct sales models of new EV manufacturers.

We attempted to incorporate the EV provisions in the IRA as much as possible but did not capture every element. Our main scenarios did not include the critical minerals requirements of the IRA in our assumptions due to the complexity of modeling them and the fact that the rules were not yet finalized, though these are incorporated into the separate section estimating consumer savings due to the IRA. We did not consider the IRA’s battery production tax, the shifts in earnings associated with the prevailing wage requirements of the IRA, or the household savings associated with its EV tax credits. While these types of price changes would impact the results in some ways, they do not impact our scenarios of EV penetration since the scenarios are set exogenously, not based on the cost of the vehicles.

Our analysis of electricity costs is based on the current electricity generation mix. We did not model changes to the energy system such as a shift to renewables or an expansion of the electric grid, given that the focus of our modeling was on the auto industry, not the broader energy system. That is, our modeling for electricity purchases considers the jobs effect of operation of electricity generation, transmission, and distribution, but not new construction.

The DEEPER model

The foundation for the overall economic assessment was the proprietary modeling system known as the Dynamic Energy Efficiency Policy Evaluation Routine (DEEPER). The model, developed by Skip Laitner in early 1992, is a quasi-dynamic input-output model of a given local, state, or national economy. The model is essentially a recipe that shows how different sectors of the economy are expected to buy and sell to each other, and how they might, in turn, be affected by changed investment and spending patterns. Setting up that production recipe is a first step in exploring the future job creation opportunities and other macroeconomic impacts as, in this case, Michigan shifts from the production of internal combustion engine vehicles to the manufacture, purchase, and use of electric vehicles over time.

Although it has been updated here to reflect the economic dynamics specific to Michigan, the formal DEEPER model has a 30-year history of development and application while even earlier versions of the tool were used by entities like the Arizona Energy Office and the Nebraska Energy Office in the mid-1980s. The model was utilized to assess the net employment impacts of proposed automobile fuel economy standards within the United States in 2012 (Busch et al. 2011). It also underpinned the 2012 Long-Term Energy Efficiency Potential study (Laitner et al. 2012). It has been employed to evaluate the macroeconomic impacts of a variety of energy efficiency, renewable energy, and climate policies at the regional, state, national, and international levels. As a recent illustration, it was used to show the positive economic and employment benefits in a 2021 assessment of a $16 trillion investment strategy to reduce the nation’s energy-related carbon emissions over the next several decades (Rifkin 2021). While this WRI report has been peer-reviewed, the DEEPER model has not been independently evaluated.

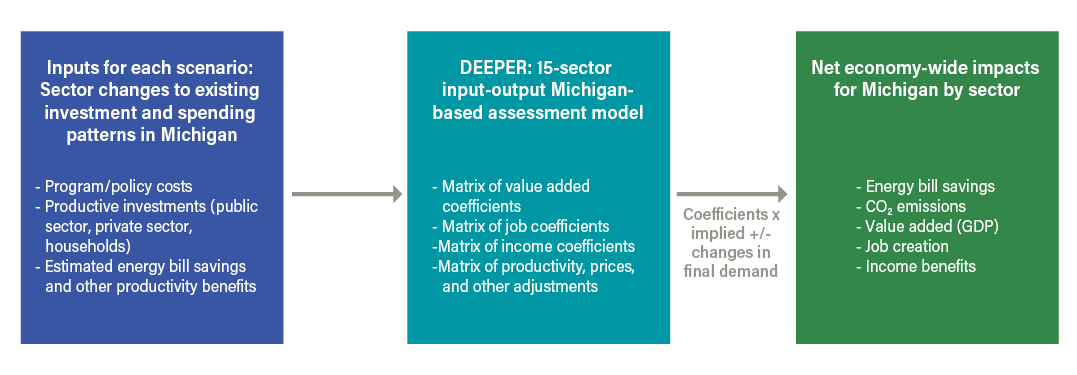
The timeframe of the model for evaluating the EV transition in Michigan was 2019 through 2040. The IMPLAN data on Michigan employment that was used as the basis for the DEEPER modeling was from 2019. The years 2019 through 2023 provided a useful benchmark. The period 2024 through 2040 afforded an assessment of future trends and is what we present in the report. As it was implemented for this analysis, the model mapped in the changed spending and investment patterns that might be undertaken as a result of the EV transition. Results are expressed in “job-years,” or employment associated with a spending and investment pattern in a given year. A single job or position created by an employer that lasts for five years is equivalent to five job-years. The structural core of the model relies on a variety of data made available by IMPLAN LLC, Woods & Poole Economics, the Bureau of Labor Statistics, and the Energy Information Administration—with all data used or purchased in 2022. Figure C-3 provides a diagrammatic view of the DEEPER Modeling System as it was reflected within the dynamics of all previous assessments.

Figure C-3 | The DEEPER Modeling System

Note: CO2 = carbon dioxide; GDP = gross domestic product.

Source: Skip Laitner.

Although the DEEPER model is not a detailed general equilibrium model, it does provide sufficient accounting to track investments and expenditures within one sector of the economy and balance them against changes in other sectors. Like any economic assessment tool, however, there are some understandable limitations. While the model reflects anticipated changes in the future costs of energy, vehicle manufacturing, and the production of batteries, it does not fully track how changes in the use and production of vehicles might affect those costs. Moreover, the model does not reflect how changes in the production of electric vehicles and batteries might affect the sales and quantity of other goods and services within Michigan. As in IMPLAN, induced employment effects were not derived directly from the Department of Commerce’s business survey evidence, so they are therefore less precise than direct and indirect employment estimates. Nonetheless, the model provides a set of what we call “useful indicative analytics” that can inform both businesses and policymakers about smart programs and policies that will likely strengthen the state’s economic well-being and future employment opportunities while significantly reducing the economic burden of greenhouse gas emissions and air pollution.

Renewable energy thought experiment

This thought experiment first estimates the average annual investment necessary to construct and install renewable energy systems from 2024 through 2040, then multiplies that total by the number of jobs likely necessary to achieve that outcome. Using Michigan-specific data from the Energy Information Administration (EIA 2022a) on the Midcontinent Independent System Operator/East Electricity Supply Region and business-as-usual projections out to the year 2040 (EIA 2022b), the state will have an electric power net summer generation capacity of 30,574 megawatts (MW) in 2023, increasing to 39,112 MW by 2040. Renewables represent about 24.5 percent of capacity in 2023, rising to 32.7 percent by 2040. In this thought experiment we imagine renewables—specifically solar photovoltaic energy—representing an 80 percent share by 2040. Adjusting for capacity factors based on the medium technology progress projections from the National Renewable Energy Laboratory’s Annual Technology Baseline (NREL 2022)—42 percent for conventional electricity generation units and 23.5 percent for solar photovoltaic—renewables must grow from an estimated 13,402 MW in 2023 to 55,969 MW by 2040, a net increase of 42,567 (Table C1).

Table C1 | Illustration of Michigan’s potential for renewable energy expansion by 2040

Implied capacity by category of generation (MW)

2023

2024

2040

(1) BAU total net generation capacity

30,574

31,020

39,112

(2) Capacity-factor adjusted renewables—80% by 2040

13,402

14,351

55,969

(3) Implied year 2040 net increase

42,567

(4) Additional renewables capacity to support EV usage

11,016

(5) Net total renewables increase

53,583

(6) Average annual increase 2024 through 2040

3,152

Note: MW = megawatt; BAU = business as usual.

Source: Authors.

However, business-as-usual projections do not include electricity to power electric vehicles. In our All Electric by 2033 scenario, by 2040 Michigan EVs will consume an estimated 22,657,614 megawatt-hours (MWh) of electricity, requiring another 11,016 MW of renewables. A total increase of 53,583 MW of new capacity over the 17-year period 2024 through 2040 suggests an average annual increase of 3,152 MW in new photovoltaic installations, per Table C-1. The Annual Technology Baseline estimates costs of $1,336 per installed kilowatt of photovoltaic systems in 2024, declining to $770/kW by 2040. We used an average cost of $1,053 per kW installed and the estimated average annual increase of 3,152 MW to arrive at an annual investment of $3,320 million (using 2019 constant dollars), per Table C-2.

Table C-2 | Michigan jobs from renewables transition thought experiment

Average annual, 2024 to 2040

Direct

Indirect

Induced

Total

Average annual investment (2019 US$, millions)

3,320

Job coefficients (per million 2019 $)

5.83

1.16

4.15

11.15

Total electricity transition jobs (actual)

19,366

3,865

13,785

37,015

EV share of electricity transition jobs (actual)

3,981

795

2,834

7,610

Source: Authors.

Using the DEEPER Modeling System sector for construction for new power and communication structures in Michigan (IMPLAN 2021), adjusted for anticipated improvements in labor productivity (BLS 2022a), we arrived at a working estimate of 19,366 direct construction jobs; 3,865 supply-chain and manufacturing jobs; and 13,785 induced jobs through wages of the direct and indirect jobs that are re-spent in Michigan. In total, the average annual employment required to support this scale of infrastructure upgrade is estimated at 37,015 jobs per year, with the EV share of the total representing about 7,610 of that (Table C2).

Benefits of IRA tax credits

Our calculations in the section “Insights on aspects not included in the model” on the minimum value and employment impact of the IRA’s EV tax credits relied on the estimated average tax credit value for all vehicles sold in the United States from the “High” scenario in Energy Innovation’s Implementing the Inflation Reduction Act (Baldwin and Orvis 2022). In this scenario, 100 percent of vehicles satisfy IRA requirements around sourcing of minerals and components from entities of concern and other tax credit requirements by 2032, and 25 percent of the battery production tax credit is passed through to consumers. To develop an average tax credit value, Energy Innovation developed annual weighted average credit estimates for both the share of vehicles that could meet IRA domestic battery assembly requirements and those that could meet critical minerals requirements. It reduced the tax credit value to reflect that only vehicles estimated to be under the IRA’s vehicle MSRP cap would qualify. It also limited the credit to whichever was least of the following three options: BEVs assembled in North America, qualifying consumers under the adjusted gross income cap, or estimates of the shares of vehicles that can meet the requirements for not sourcing materials from entities of concern. A 5 percent transferability penalty was applied to further reduce the average tax credit value to reflect transaction costs.

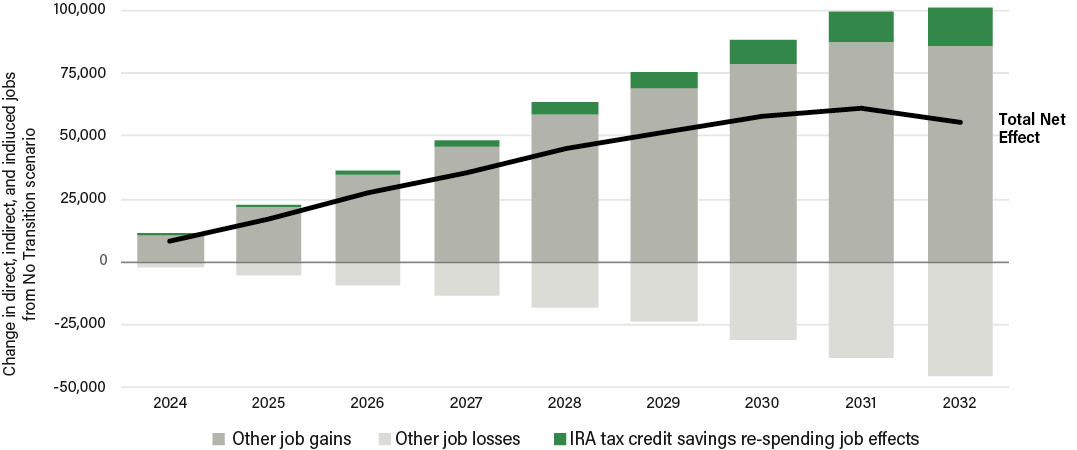
Our analysis used an estimated tax credit value that differs from the value used in Energy Innovation’s analysis only in that it removed the estimated value of state EV rebates and incentives given that Michigan does not offer any. We calculated consumer savings due to IRA provisions by multiplying this average tax credit value by the number of vehicles sold to Michiganders in each year. For our estimate of the maximum consumer savings due to the IRA, we used the annual weighted average credit estimates from the High scenario of Energy Innovation and ICCT’s January 2023 report Analyzing the Impact of the Inflation Reduction Act on Electric Vehicle Uptake in the United States (Slowik et. al 2023).

Appendix D: Full modeling results by scenario

Table D-1 | Expenditures by scenario (US$, millions)

Sector

Scenario

2024

2030

2040

Auto manufacturing: Everything except batteries

All Electric by 2033, High Competitive case

$43,687

$61,883

$55,305

All Electric by 2033, Low Competitive case

$38,959

$38,939

$34,573

No Transition

$40,475

$45,568

$40,510

Auto manufacturing: Battery manufacturing

All Electric by 2033, High Competitive case

$130

$4,835

$6,732

All Electric by 2033, Low Competitive case

$167

$1,861

$2,244

No Transition

$0

$0

$0

EV charging infrastructure

All Electric by 2033

$146

$607

$865

No Transition

$0

$0

$0

Gasoline purchases

All Electric by 2033

$252

$1,164

$135

No Transition

$350

$2,614

$4,312

Electricity purchases

All Electric by 2033

$52

$814

$2,647

No Transition

$0

$0

$0

Auto maintenance and repair

All Electric by 2033

$480

$3,106

$4,029

No Transition

$540

$4,018

$6,740

Auto finance

All Electric by 2033

$1,826

$11,641

$10,263

No Transition

$1,753

$11,467

$10,856

Insurance, taxes, and fees

All Electric by 2033

$264

$3,932

$6,583

No Transition

$519

$3,868

$6,502

Net savings on total cost of ownership

All Electric by 2033

$24

$1,309

$4,753

No Transition

$0

$0

$0

Note: Full set of expenditures available upon request.

Source: Authors.

All Electric by 2033 scenario

High Competitive case

Table D-2 | Net jobs impact compared with No Transition scenario

All Electric by 2033 scenario—High Competitiveness case

2030 

2040 

Average annual job impact 

Cumulative impact 2024–40 (job-years) 

Auto manufacturing: Battery manufacturing

33,505

42,325

32,460

551,816

Auto manufacturing: Everything except batteries 

22,765

-1,682

9,538

162,139

EV charging infrastructure 

6,499

7,454

6,630

112,711

Net savings re-spending 

8,538

26,919

14,019

238,328

EV electricity 

4,216

11,756

6,248

106,212

Gasoline 

-19,763

-46,144

-26,826

-456,040

Insurance, taxes, and fees 

639

706

649

11,033

Maintenance and repair 

-11,173

-25,709

-15,061

-256,030

Finance 

2,148

-6,411

-1,131

-19,226

Total net effect 

47,374

9,214

26,526

450,943

Source: Authors.

Table D-3 | Absolute jobs impact (from production and use of vehicles post-2024, not vehicles in use before 2024 that are still on the road)

All Electric by 2033 scenario—High Competitiveness case 

2030 

2040 

Average annual job impact 

Cumulative total impact 2024–40 (job-years) 

Auto manufacturing: Battery manufacturing

33,505

42,325

32,460

551,816

Auto manufacturing: Everything except batteries 

250,520

180,089

222,798

3,787,569

EV charging infrastructure 

6,499

7,454

6,630

112,711

Net savings re-spending 

8,538

26,919

14,019

238,328 

EV electricity 

4,216

11,756

6,248

106,212

Gasoline 

15,867

1,489

11,696

198,835

Insurance, taxes, and fees 

38,907

57,151

42,682

725,601

Maintenance and repair 

38,046

38,212

36,356

618,058

Finance 

143,232

111,667

114,081

1,939,374

Total effect 

539,330

477,062

486,970

8,278,504

Source: Authors.

Low Competitive case

Table D-4 | Net jobs impact compared with No Transition scenario

All Electric by 2033 scenario—Low Competitiveness case 

2030 

2040 

Average annual job impact 

Cumulative total impact (job-years) 

Auto manufacturing: Battery manufacturing

12,896 

14,108 

12,034

204,575 

Auto manufacturing: Everything except batteries 

-60,268 

-63,172 

-54,026

-918,443 

EV charging infrastructure 

6,499 

7,454 

6,630

112,711 

Net savings re-spending 

8,538 

26,919 

14,019

238,328 

EV electricity 

4,216 

11,756 

6,248

106,212 

Gasoline 

-19,763 

-46,144 

-26,826

-456,040 

Insurance, taxes, and fees 

639 

706 

649

11,033 

Maintenance and repair 

-11,173 

-25,709 

-15,061

-256,030 

Finance 

2,148 

-6,411 

-1,131

-19,226 

Total net effect 

-56,268

-80,493

-57,464

-976,880 

Source: Authors.

Table D-5 | Absolute jobs impact (from production and use of vehicles post-2024, not vehicles in use before 2024 that are still on the road)

All Electric by 2033 scenario—Low Competitiveness case 

2030 

2040 

Average annual job impact 

Cumulative total impact (job-years) 

Auto manufacturing: Battery manufacturing

12,896 

14,108 

12,034

204,575 

Auto manufacturing: Everything except batteries 

167,487 

118,599 

159,235 

2,706,987

EV charging infrastructure 

6,499

7,454

6,630

112,711

Net savings re-spending 

8,538

26,919

14,019

238,328

EV electricity 

4,216

11,756

6,248

106,212

Gasoline 

15,867

1,489

11,696 

198,835

Insurance, taxes, and fees 

38,907

57,151

42,682

725,601

Maintenance and repair 

38,046

38,212

36,356

618,058

Finance 

143,232

111,667 

114,081

1,939,374

Total effect 

435,688

387,355

402,981

6,850,681

Source: Authors.

Range of the High and Low Competitiveness cases in the All Electric by 2030 scenario

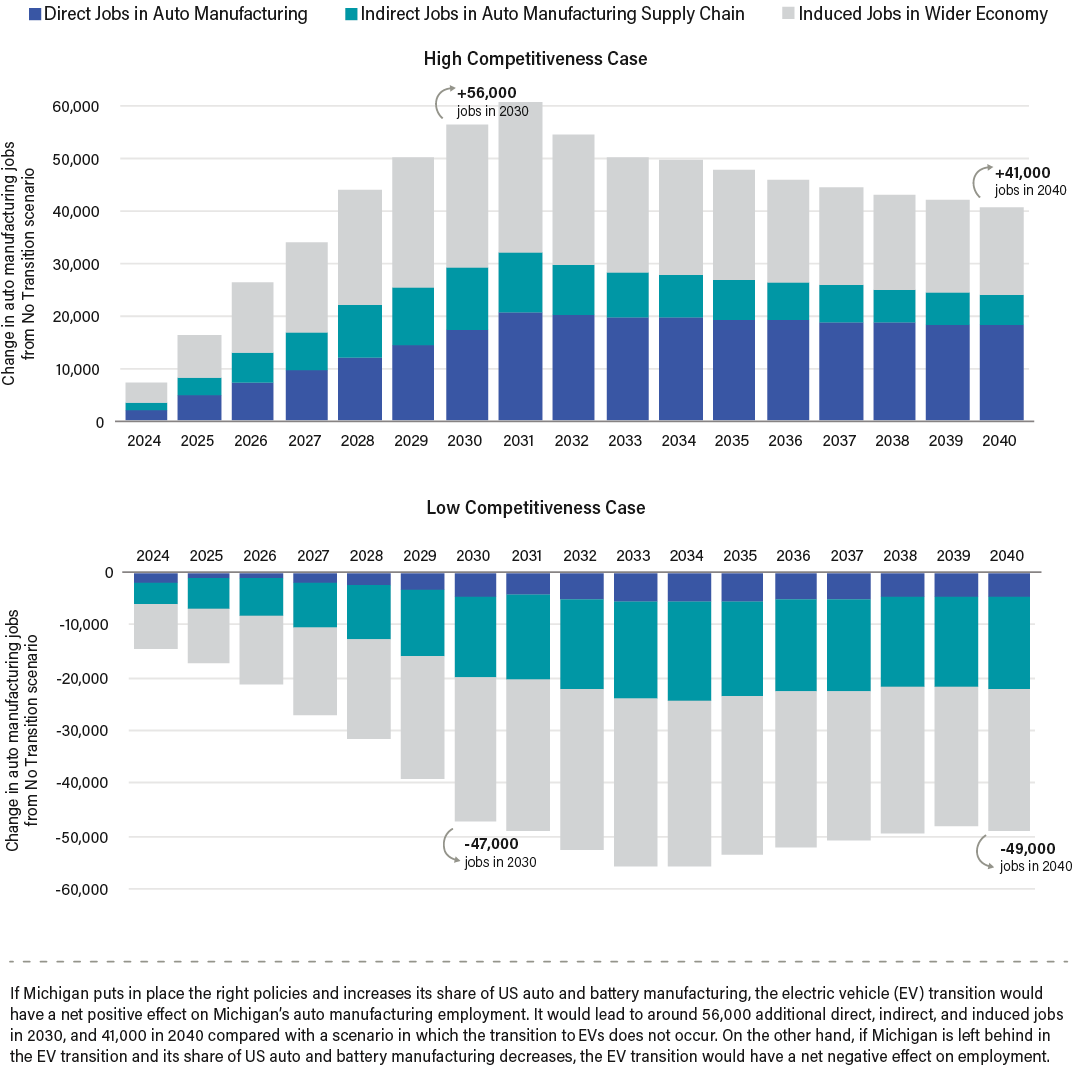
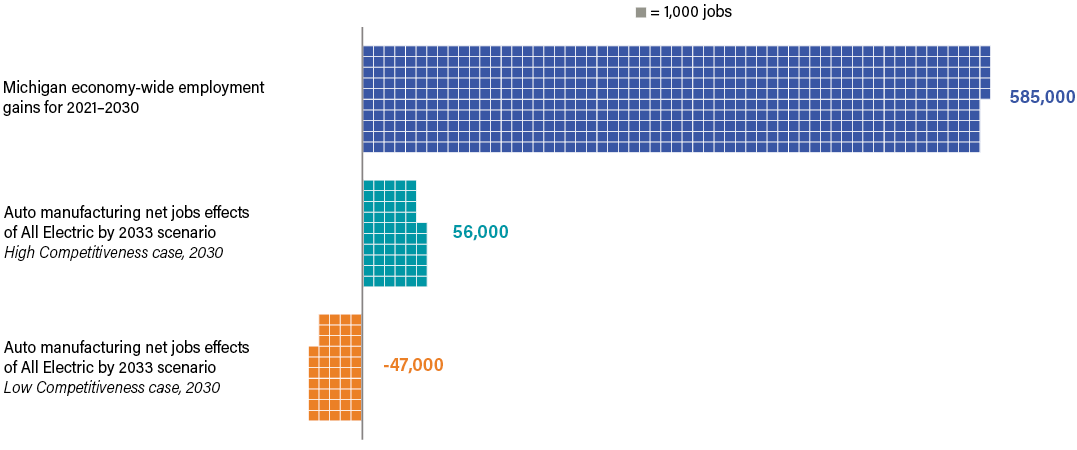
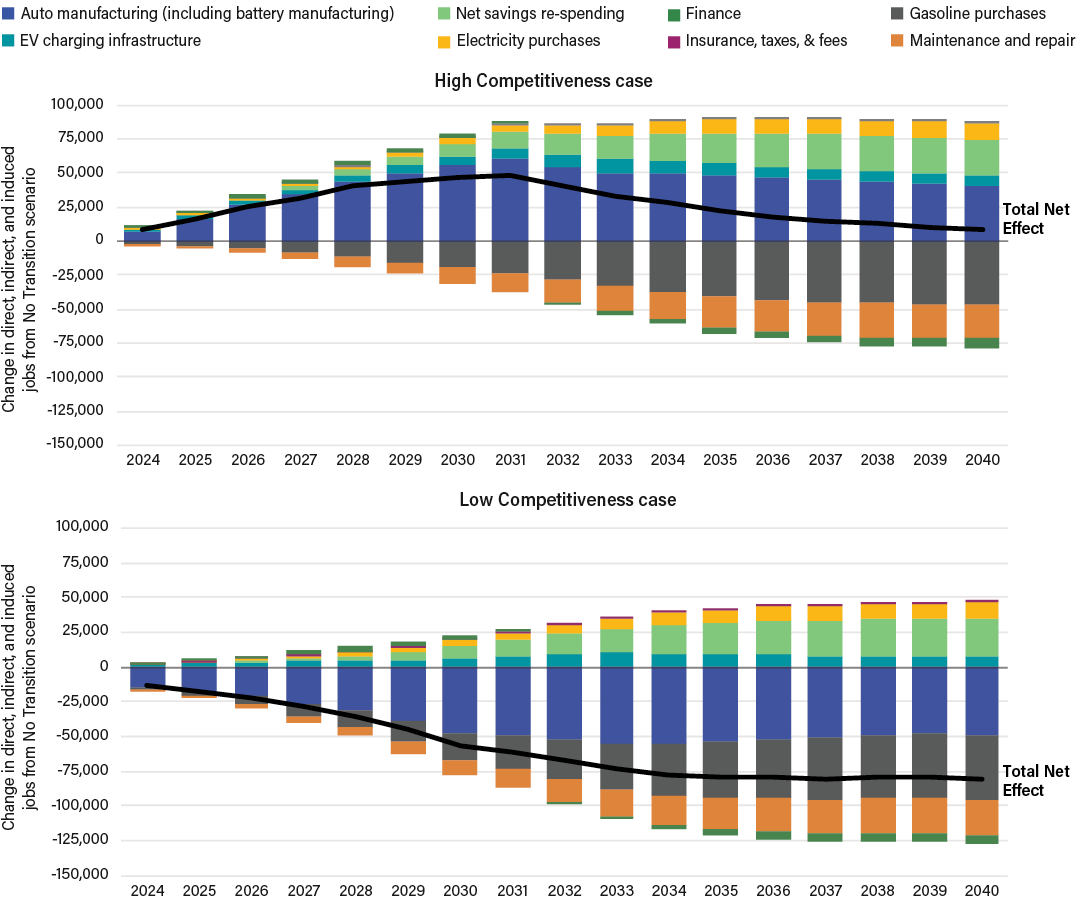
The High and Low Competitiveness cases form a range of what outcomes in Michigan could occur under an All Electric by 2033 scenario. This range is from around 27,000 more net jobs supported on average per year compared with a No Transition scenario (in the High Competitiveness case) to around 57,000 fewer net jobs supported on average per year compared with a No Transition scenario (in the Low Competitiveness case). The average of two cases would be around 15,000 fewer jobs supported on average per year compared with a No Transition scenario. Whether Michigan ends up on the upper or lower end of this spectrum depends on whether the state puts in place the right policies to be a leader in auto and battery manufacturing going forward.

Current Policy scenario

In the Current Policy scenario, the United States and Michigan reach around 50 percent of LDV sales in 2030 and around 90 percent of sales in 2040. This is based on national sales expectations. For Michigan’s auto manufacturing sector, national sales trends are important because Michigan exports cars to states across the nation. The number of EVs sold in Michigan itself will likely lag these expectations without more policies, but the scenario is consistent with the MI Healthy Climate Plan target of 50 percent EV LDV sales by 2030.

We offer results for the High and Low Competitive cases of the Current Policy scenario in Tables D-6 to D-9. On average, in the High Competitive case the Current Policy scenario sees a net gain of about 34,000 jobs a year over a No Transition scenario. In the Low Competitiveness case it sees an average net loss of 55,000 jobs a year. We also report results for the absolute employment impacts of the Current Policy scenario in both cases, independent of any comparison to the No Transition scenario.

High Competitiveness case

Table D-6 | Net jobs impact compared with No Transition scenario

Current Policy scenario—High Competitiveness case

2030 

2040 

Average annual jobs impact 

Cumulative impact 2024–40 (job-years) 

Auto manufacturing: Battery manufacturing

28,848 

39,160 

28,290

480,922 

Auto manufacturing: Everything except batteries 

27,304 

1,681 

15,261

259,436 

EV charging infrastructure 

5,210 

6,492 

5,040

85,676 

Net savings re-spending 

6,810 

21,526 

10,849

184,437 

EV electricity 

3,414 

9,322 

4,863

82,678 

Gasoline 

-16,101 

-36,371 

-20,968

-356,450 

Insurance, taxes, and fees 

543 

531 

526

8,947 

Maintenance and repair 

-9,074 

-20,270 

-11,753

-199,797 

Finance 

2,018 

-5,742 

-712

-12,097 

Total net effect 

46,953 

22,072 

32,109

545,851 

Source: Authors.

Table D-7 | Absolute jobs impact (from production and use of vehicles post-2024, not vehicles in use before 2024 that are still on the road)

Current Policy scenario—High Competitiveness case

2030 

2040 

Average annual jobs impact 

Cumulative total impact 2024–40 (job-years) 

Auto manufacturing: Battery manufacturing

28,848 

39,160 

28,290 

480,922 

Auto manufacturing: Everything except batteries 

255,059 

183,452 

228,522 

3,884,866 

EV charging infrastructure 

5,210 

6,492 

5,040 

85,676 

Net savings re-spending 

6,810 

21,526 

10,849 

184,437 

EV electricity 

3,414 

9,322 

4,863 

82,678 

Gasoline 

19,529 

11,262 

16,688 

283,694 

Insurance, taxes, and fees 

38,811 

56,977 

43,560

723,515 

Maintenance and repair 

40,145 

43,652 

39,664 

674,291 

Finance 

143,103 

111,667 

114,500

1,946,503 

Total effect 

540,929 

483,510 

491,976 

8,346,582 

Source: Authors.

Low Competitiveness case

Table D-8 | Net jobs impact compared with No Transition scenario

Current Policy scenario—Low Competitiveness case 

2030 

2040 

Average annual jobs impact 

Cumulative total impact (job-years) 

Auto manufacturing: Battery manufacturing

11,103 

13,053 

10,588

179,989 

Auto manufacturing: Everything except batteries 

-58,476 

-61,130 

-50,642

-860,907 

EV charging infrastructure 

5,210 

6,492 

5,040

85,676 

Net savings re-spending 

6,810 

21,526 

10,849

184,437 

EV electricity 

3,414 

9,322 

4,863

82,678 

Gasoline 

-16,101 

-36,371 

-20,968

-356,450 

Insurance, taxes, and fees 

543 

531 

526

8,947 

Maintenance and repair 

-9,074 

-20,270 

-11,753

-199,797 

Finance 

2,018 

-5,742 

-712

-12,097 

Total net effect 

-54,554 

-72,588 

-52,207

-887,523 

Source: Authors.

Table D-9 | Absolute jobs impact (from production and use of vehicles post-2024, not vehicles in use before 2024 that are still on the road)

Current Policy scenario—Low Competitiveness case 

2030 

2040 

Average annual jobs impact 

Cumulative total impact (job-years) 

Auto manufacturing: Battery manufacturing

11,103 

13,053 

10,588 

179,989 

Auto manufacturing: Everything except batteries 

169,279 

120,641 

162,619 

2,764,523 

EV charging infrastructure 

5,210 

6,492 

5,040 

85,676 

Net savings re-spending 

6,810 

21,526 

10,849 

184,437 

EV electricity 

3,414 

9,322 

4,863 

82,678 

Gasoline 

19,529 

11,262 

16,688 

283,694 

Insurance, taxes, and fees 

38,811 

56,977 

43,560

723,515 

Maintenance and repair 

40,145 

43,652 

39,664 

674,291 

Finance 

143,103 

111,667 

114,500

1,946,503 

Total effect 

437,404 

394,592 

408,371 

6,925,306 

Source: Authors.

Range of the High and Low Competitiveness cases, Current Policy scenario

The High and Low Competitiveness cases form a range of what outcomes in Michigan could occur under a Current Policy scenario. This range is from around 32,000 more net jobs supported on average per year compared with a No Transition scenario (in the High Competitiveness case) to around 52,000 fewer net jobs supported on average per year compared with a No Transition scenario (in the Low Competitiveness case). The average of these two cases would be around 10,000 fewer jobs supported on average per year compared with a No Transition scenario. Whether Michigan ends up on the upper or lower side of this spectrum depends on whether Michigan puts in place the right policies to be a leader in auto and battery manufacturing going forward.

No Transition scenario

The No Transition scenario in Table D-10 projects the employment impacts of a counterfactual scenario in which only ICE vehicles are sold, and Michigan retains its present-day 20 percent share of the domestic auto manufacturing market. Net impacts of the Current Policy and All Electric by 2033 scenarios are reported in relation to it. It was chosen as a reference scenario to understand the scale of the jobs effects of the EV transition in comparison to what it would have been if the industry had not changed at all.

Table D-10 | Absolute jobs impact (from production and use of vehicles post-2024, not vehicles in use before 2024 that are still on the road)

Reference scenario—No Transition

2030 

2040 

Average annual job impact 

Cumulative total impact (job-years) 

Auto manufacturing: Battery manufacturing

Auto manufacturing: Everything except batteries 

227,755 

181,771 

213,261

3,625,430 

EV charging infrastructure 

Net savings re-spending 

EV electricity 

Gasoline 

35,630 

47,633 

37,656

640,144 

Insurance, taxes, and fees 

38,268 

56,445 

42,033

714,568 

Maintenance and repair 

49,219 

63,921 

51,417

874,088 

Finance 

141,085 

117,409 

115,212

1,958,600 

Total effect 

491,956 

467,180 

459,579

7,812,830 

Source: Authors.

Appendix E: Community benefits agreements—making economic development projects accountable

What is a community benefits agreement (CBA)?

A CBA is typically a private agreement made between community groups and project developers that spells out all the benefits for the community that a developer has agreed to provide as part of a development project (Berglund 2021; Wolf-Powers 2010).

CBAs are based on the premise that economic development projects should benefit local communities, especially low-
income communities and communities of color, and create tangible improvements in their lives. The benefits provided through a CBA can vary, depending on the needs of the community, the size and scope of the development project, and the relative bargaining power of the community group and the project developer (Been 2010). Some common benefits include the following:

  • Employment opportunities. CBAs can increase local hiring by incorporating provisions that prioritize community members for jobs created by the project. Additionally, CBAs can emphasize job quality by incorporating requirements that new jobs pay decent wages and offer benefits. Finally, CBAs can also provide funding to create pipelines for education and workforce development.
  • Infrastructure improvements. These can include setting aside money to provide for affordable housing, improving schools and other community facilities, and enhancing public access to new development areas.

CBAs are becoming popular. The first major CBA—the Los Angeles Staples Center agreement—was signed in 2001; since then several CBAs between community groups and private developers have been created. A recent poll found that 59 percent of likely voters support the use of CBAs in various development projects and that this support holds across party lines (Fraser 2022).

In a few recent cases, though, local governments have adopted CBAs through ordinances, as has happened in Detroit (more below) and St. Petersburg, Florida. New Jersey is the first state in the country to require CBAs for certain economic development projects with upfront costs of $10 million or more. The Economic Recovery Act of 2020 has created two programs—Emerge and Aspire—to encourage economic development in priority sectors and targeted communities.

When we discuss CBAs in this report, we are referring to CBAs adopted as government policies. Formalizing CBAs into policy can make them more effective by ensuring that development projects that receive public subsidies contribute to the community and the region in ways that are desirable for residents and align with the economic development vision of the local government or state.

Detroit’s community benefits ordinance

Detroit voters passed the nation’s first municipal community benefits ordinance (CBO) in 2016. It is the first ordinance to “systematize and routinize community benefit negotiations” between communities and project developers and it therefore provides valuable lessons for policymakers (Berglund 2021).

Detroit’s CBO applies to projects that are $75 million or more in value, receive $1 million or more in property tax abatement, or receive $1 million or more in a transfer of city-held land. Negotiations are arranged by the city’s Planning and Development Department and take place between a nine-member Neighborhood Advisory Council (NAC) and the developer. The NAC includes residents from the project impact area, with two members elected by the residents, four members selected by the Planning and Development Department, two members selected by at-large city council members, and one member selected by the city council member with the largest portion of the project in their district. Once the NAC is formed, there are a series of negotiations between the NAC and the developer regarding the benefits. The city council signs off once an agreement is made. The city’s Civil Rights, Inclusion & Opportunity Office enforces the benefits but is not authorized by the ordinance to issue any fines or injunctions when targets are not being met.

Detroit’s CBO has been applied to more than 11 projects, with communities able to secure several benefits related to parks and public space improvements, employment and workforce development, public engagement, affordable housing, and parking and public transportation (Berglund 2021). In one example, the NAC that negotiated with Ford for the renovation of Michigan Central Station as a mobility innovation district was able to get Ford to commit $2.5 million to the city’s affordable housing fund, $5 million for citywide job training initiatives, and $2.5 million for city neighborhood improvements (Pinho 2018).

Detroit’s CBO has also faced criticisms on a variety of fronts. The ordinance requires only one meeting between the NAC and the developer and while the city’s planning staff in practice have facilitated more than one meeting, it creates the perception that the city is more receptive to the preferences of developers than the needs of community members (Berglund 2021). Several projects with substantial potential impact on residents did not meet the $75 million threshold and failed to trigger the CBO. As a result, community organizations have been advocating to lower the project value threshold to $50 million (Frank 2022; Mondry 2021).

Other criticisms relate to the lack of an adequate enforcement mechanism, the NACs not being truly representative of the impacted communities, and benefits often being insufficient given the size of subsidies given to project developers. Additionally, it is difficult for communities to create or maintain leverage throughout the process of developing such agreements, whether through media pressure or having a say at points when decisions are made or approved. Detroit’s CBO has also been criticized for failing to protect the health and quality of life of nearby residents by allowing Stellantis to violate the state’s air quality law (Brooker 2022).

Building blocks of a strong CBA policy

Below are key guidelines that can strengthen CBAs that have been codified into law by local governments. These guidelines can also apply to statewide policy adoption of CBAs.

  • Make CBAs legally binding and enforceable to hold companies accountable. CBAs should include clear metrics to measure, implement, and track commitments made by a project developer, as well as public reporting requirements. In addition, CBAs should incorporate clawback provisions requiring companies to return funds for noncompliance along with penalties that are substantial enough to deter companies from violating their agreements. CBAs should also include guidelines on who will be responsible for enforcing commitments.
  • Enact policies establishing baseline community benefits. While there can be legal limitations to the demands that state and local governments can make as part of the CBA process, policymakers have the power to adopt baseline community benefits for economic development projects. These can include requirements related to prevailing wage, local hiring (especially connecting individuals facing barriers to employment to newly created jobs), and mitigation of negative environmental impacts.
  • Ensure diverse community representation. Robust CBAs are created by including a representative and diverse group of members from the community impacted by the project. When choosing community representation, effort should be made to nominate and elect those who have deep, active connections to the community and, thus, truly represent their communities. Additionally, the local community should be provided with opportunities to provide input and feedback throughout the process.
  • Provide training and capacity to community members negotiating on behalf of local communities. Without this, the negotiation process can be biased toward the developers who tend to be more familiar with development practices and policies. Local and state governments can connect community members with regional or national networks that have experience with CBAs and who can provide technical assistance and resources. Allowing for negotiations to be mediated by trained third-party facilitators can also help address this issue.
  • Adopt realistic timelines for reaching benefits agreements. Project developers and community members may have different timelines for negotiations, with the community needing more time than what the developer would prefer. While CBA negotiations should not unduly impact the project development timeline, adequate time should be given to ensure that community members are able to successfully negotiate benefits agreements.
  • Incorporate a strong focus on environmental sustainability and justice. Sometimes developers and government, in pursuit of new development, are incentivized to choose communities that are perceived to have less capacity to resist projects. These development projects can impose health and pollution burdens on those living in proximity. CBAs can be a mechanism to promote environmental justice by incorporating requirements for timely and clear information about a project’s environmental and health impacts and mitigation of negative impacts on communities.

Appendix F: Examples of state policies and programs to support a just and equitable EV transition

Table F-1 provides examples of programs and policies from other states and the federal government that Michigan can consider adopting and/or modifying to address the challenges and seize the opportunities presented by the EV transition. While the examples under the just workforce and community transition are often related to coal community and workforce transition, they can be adapted for the auto sector transition.

Table F-1 | State programs and policies for Michigan to consider

State

Program/policy

Description

Just workforce and community transition

Coloradoa

Office of Just Transition

In 2019, Colorado created the nation’s first Office of Just Transition to help communities transition their economies away from coal. The office has developed a Colorado Just Transition Action Plan, which lays out strategies to help coal communities, and has started disbursing funding from its Just Transition Cash Fund for economic diversification projects and worker assistance programs.

Connecticutb

An Act Concerning a Just Transition to Climate-Protective Energy Production and Community Investment (2021)

Renewable energy project developers must provide construction, maintenance, and security workers with prevailing wages and benefits. The law applies to both publicly and privately funded projects. Developers of renewable energy projects that are 5 MW or more must enter into a community benefits agreement and develop a workforce development plan that incorporates apprenticeship and pre-apprenticeship programs to provide workers pathways into trade careers.

Illinoisc

Climate and Equitable Jobs Act (2021)

This legislation includes robust provisions for workers displaced by the energy transition and “environmental justice communities” that have borne a disproportionate pollution burden. The legislation has created an $80 million per year program for clean energy job training hubs that prioritize displaced energy workers, individuals from environmental justice communities, and underserved individuals. The law requires developers of renewable energy projects to hire a workforce that includes at least 10% equity-eligible people, including displaced energy workers. The legislation has also created an Energy Transition Community Grant Program to provide funding to communities impacted by fossil fuel facility retirement. Finally, the legislation requires utilities and coal mining operators to provide at least two years’ notice to workers, local governments, and the Department of Commerce and Economic Opportunity before any mass layoff takes place at a power plant or coal mine.

Marylandd

Just Transition Employment and Retraining Working Group

The Climate Solutions Now Act of 2022 directs the Maryland Commission on Climate Change to create the Just Transition Employment and Retraining Working Group to assess challenges and opportunities related to workforce development, job loss, job creation, and potential training opportunities.

Massachusettse

Clean Energy Workforce Equity Program

Administered by the Massachusetts Clean Energy Center, the program promotes employment diversity in the clean energy industry. Equity Workforce Training Implementation Grants of $50,000 each are awarded to community organizations to prepare residents of environmental justice communities and fossil fuel workers for clean energy careers.

Minnesotaf

Community Energy Transition Grant Program

Established in the Department of Employment and Economic Development in 2019, the program provides grants to eligible communities to address the challenges of economic dislocation associated with the closing of a local electricity generating plant powered by coal, gas, or nuclear energy. Grant money can be used for planning and implementing activities that help with worker reemployment.

New Mexicog

Energy Transition Act (2019)

The legislation created an Energy Transition Displaced Worker Assistance Fund that can be used to develop job training and apprenticeship programs in impacted communities. The legislation also created the Energy Transition Economic Development Assistance Fund to support economic diversification opportunities in affected communities.

New Yorkh

Electric Generation Facility Cessation Mitigation Program

Created in 2015 by Senate Bill S6408C, the program provides up to seven years of revenue replacement funding to local government entities (counties, towns, cities, school districts) impacted by the closure of an electricity generating facility. As of April 2021, New York had authorized $140 million for the program.

United Statesi

Four Corners Rapid Response Team

Created by the federal government’s Interagency Working Group on Coal and Power Plant Communities and Economic Revitalization, the Rapid Response Team coordinates activities across 11 federal agencies and their regional staff to partner with local government officials and community organizations in Arizona, Colorado, New Mexico, and Utah to help them navigate the energy transition. The Rapid Response Team assists with mapping their existing assets and opportunities and accessing federal programs and resources, especially those available through the IIJA.

Equitable EV and charging infrastructure deployment

Coloradoj

ReCharge Colorado program

The program provides coaching services to consumers, local governments, workplaces, and owners of multiunit dwellings to help them identify monetary savings, grant opportunities, and other EV benefits.

Connecticutk

Electric Vehicle Charging Program

The program requires utilities to offer incentives to reduce the cost of installing charging infrastructure, including EVSE and fast-charging stations, in addition to accompanying rate design offerings. The program increases incentive amounts for underserved communities to help deploy EV charging infrastructure in such communities.

Delawarel

Vehicle-to-Grid Energy Credit

The credit provides retail electricity customers with at least one grid-integrated EV to receive kilowatt-hour credits for energy discharged to the grid from the EV’s battery at the same rate that the customer pays to charge the battery.

Marylandm

EV Charging Station New Construction Requirement

Builders must provide buyers with a Level 2 EV charging station or electric pre-wiring to support a Level 2 EV charging station in all new homes with a garage, carport, or driveway. The builder must provide buyers with information about EV charging station make-ready options and all available rebate programs for EV charging station purchases and installation.

Massachusettsn

Multiunit Dwelling EVSE Grants

The grants cover 60% of the cost of Level 1 or Level 2 chargers installed in multiunit dwellings, capped at $50,000, for private, public, or nonprofit multiunit dwellings with 10 or more residential units.

Oregono

House Bill 2180

The bill amended the state building code to require that 20% of parking spaces at all newly constructed commercial buildings, multifamily residences with five or more units, and mixed-use developments have the electrical capacity to support Level 2 EV charging stations.

Virginiap

Mileage Choice Program

A voluntary opt-in program for drivers of EVs and fuel-efficient vehicles to pay their highway use fees on a per-mile basis instead of as an annual fee, capping the total paid at the price of the annual fee.

Innovation-oriented economic development

Connecticutq

Governor’s Innovation Fellowship

Created to help retain more outstanding college and university STEM graduates in the state, the program was launched in 2019 as a pilot in Stamford and was expanded statewide in 2022. Fellows receive a $5,000 grant and a growth-track position in an innovation-based Connecticut company.

Georgiar

Electric Mobility and Innovation Alliance

Created in 2021 and led by the Georgia Department of Economic Development, the statewide initiative is focused on growing the state’s electric mobility ecosystem and strengthening Georgia’s position in EV-related manufacturing and innovation. The initiative includes government, industries, electric utilities, education, nonprofits, and other relevant stakeholders. Five committees will develop policy recommendations related to supply chain, infrastructure, workforce, innovation, and policy/initiative categories.

Illinoiss

Reimagining Electric Vehicles in Illinois Act (2021)

The legislation offers tax incentives for businesses that manufacture EVs and their parts. Businesses can receive a state income tax credit of 75 or 100% of payroll taxes withheld from each new employee and 25 or 50% for current employees. It also provides tax credits to defray the cost of training new or current employees. Finally, the legislation creates an EV Permitting Task Force to ensure a streamlined permitting process.

Illinoist

The Electric Vehicle-Energy Storage Manufacturing Training Academy (EVES MTA)

Heartland Community College (HCC) provides certificates and degrees in EV and energy storage technologies. The EV component trains individuals for employment in advanced manufacturing, installation, final assembly, inspection, diagnosis, service, and repair. The EVES MTA is a partnership with Rivian and other regional manufacturing, economic development, and education partners. The Department of Commerce and Economic Opportunity has provided a $7.5 million capital grant to HCC for the construction of the EVES MTA facility. HCC and employer partners will contribute $1.5 million to cover curriculum development, equipment, and student support.

Indianau

Innovation Voucher Program

A partnership between the Indiana Economic Development Corporation and Elevate Ventures, a private venture development organization, the program provides up to $50,000 in funding for innovation-driven research and product development to Indiana-based startups and small businesses. Eligible companies can purchase services from higher education institutions and nonprofit research providers to support R&D, product development, and commercialization.

North Carolinav

Clean Energy Youth Apprenticeship Program

This is a pre-apprenticeship program for high school juniors and seniors to prepare them for careers in clean energy. Students get a combined 96 hours of classroom instruction with 80 hours of paid on-the-job training and five industry certifications on completing the program. Students enrolling in a registered apprenticeship program after graduating from the pre-apprenticeship program receive a tuition waiver at a state community college.

Wisconsinw

Vehicle Battery and Engine Research Tax Credits

A corporation involved in qualified research is eligible for a tax credit equal to 11.5% of the qualified research expenses that the corporation incurs in Wisconsin during the taxable year.

Note: R&D = research and development.

Sources: a. CDLE n.d.; b. Connecticut Senate 2021; c. Pruitt and Munson 2021; d. MDOE n.d.; e. MassCEC n.d.; f. MDEED n.d.; g. New Mexico Senate 2019; h. NYS n.d.; i. DOE 2022a; j. CEO n.d.; k. CDEEP n.d.; l. DOE n.d.a; m. DOE n.d.b; n. DOE n.d.c; o. ODCBS 2022; p. VDMV n.d.; q. CTNext 2021; r. GDED n.d.; s. IGA n.d.; t. HCC n.d.; u. Elevate Ventures n.d.; v. NCBCE n.d.; w. DOE n.d.d.

Start reading