Foreword
mateus campos felipe/Unsplash
Food security, people, climate. These three words are inextricably linked; changes to one will inevitably affect the others. As climate change threatens food-producing regions, what changes are needed to feed a growing population? How can we shift food systems to better adapt to the changing climate? More explicitly, how can policymakers help hundreds of millions of small-scale agricultural producers to enhance food security and improve livelihoods despite the challenges that climate change brings?
Food Systems at Risk: Transformative Adaptation for Long-Term Food Security addresses these questions. It offers policymakers, funders, and researchers bold recommendations to advance transformative approaches by leveraging new types of data and analytical tools and rethinking how we plan and invest. The report authors synthesized dozens of research studies on how climate change is affecting food systems. They also interviewed farmers, government officials, and decision-makers in financial institutions and agricultural support and research organizations.
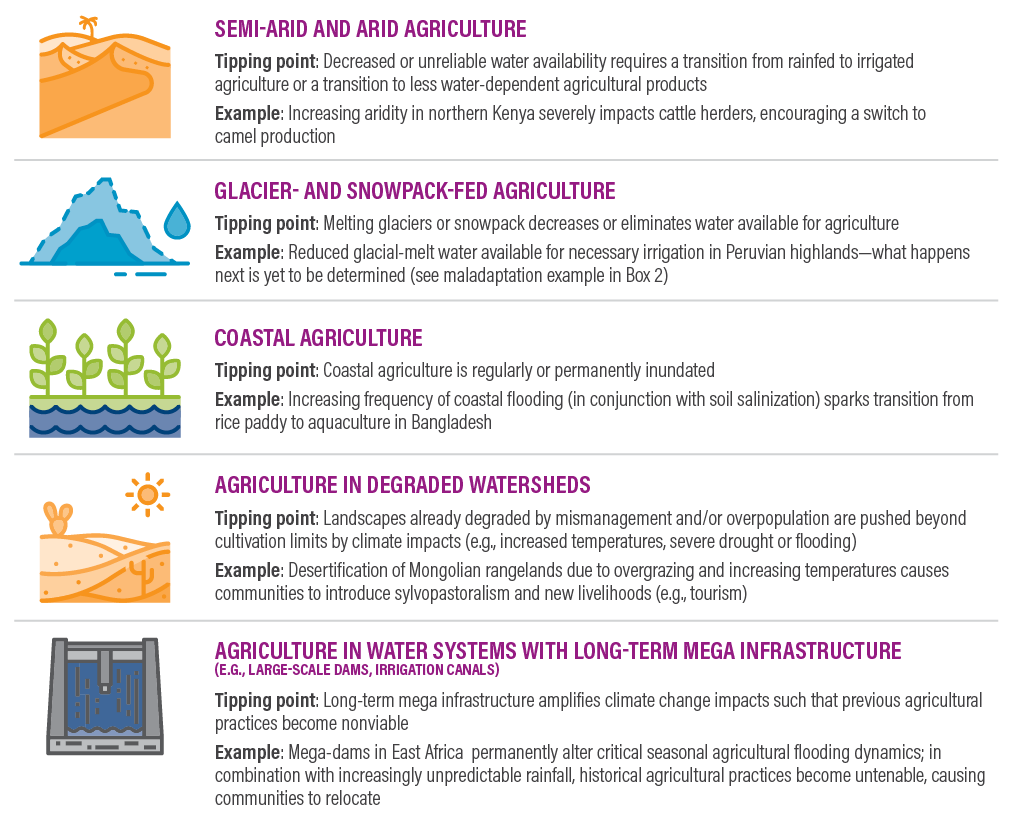
The report highlights how climate change will negatively impact food systems, particularly in climate hotspots such as semi-arid and desert regions in India and sub-Saharan Africa, coastal rice paddy regions in Bangladesh and Vietnam, and glacier and snow-fed agricultural areas in Peru and the Himalayas. It finds that incremental adaptation, while important, will be insufficient to avert dramatic increases in hunger, poverty, and displacement over the next 30 years. Instead, greater commitments to plan, fund, and implement transformative adaptation measures will be essential to ensure food security.
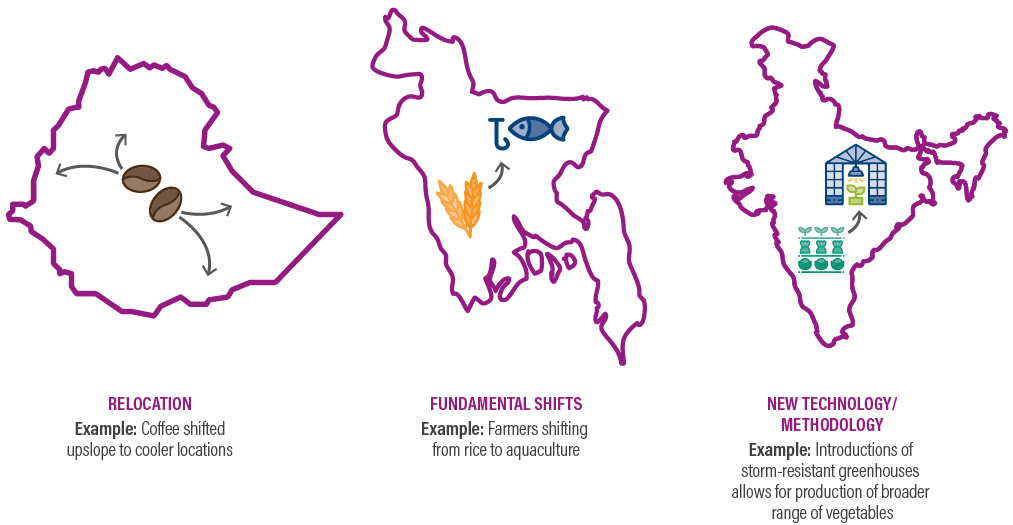
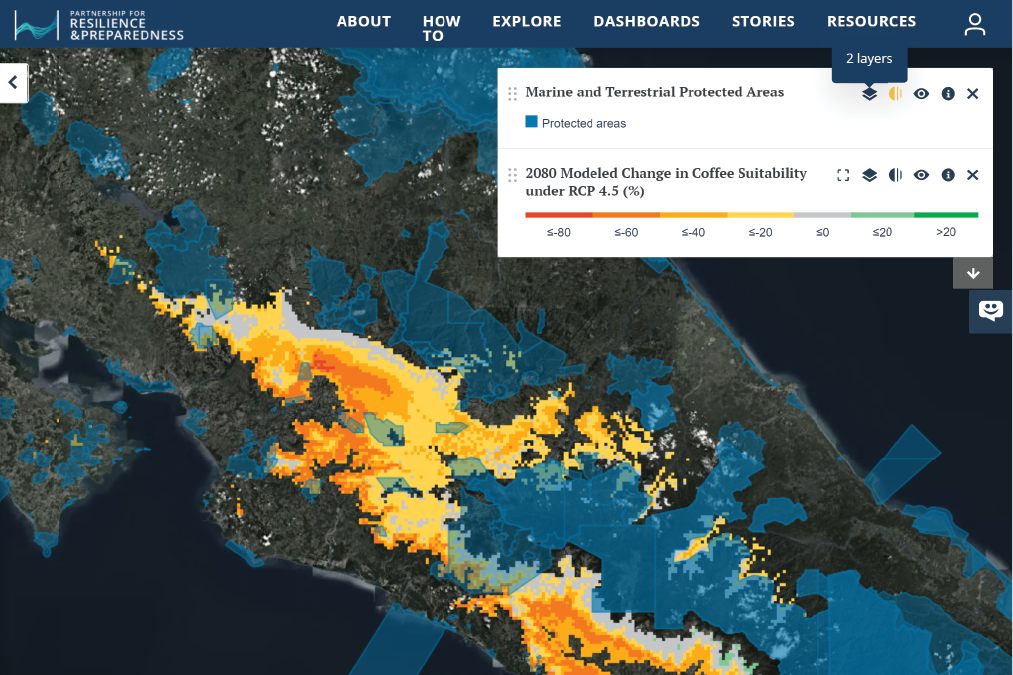
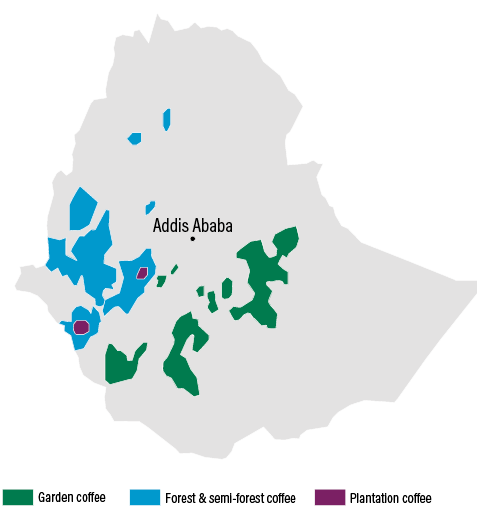
As this report illustrates, transformative approaches to agricultural adaptation will mean continually shifting the locations of where specific types of crops and livestock are produced to areas with more suitable climatic conditions – for example, grain farmers in Ethiopia moving staple crops such as maize to higher elevations as temperatures rise. It will also require changing agricultural production systems to better fit changing landscapes and ecosystems, such as rice growers in Bangladesh shifting to aquaculture in response to increased salinity due to rising sea levels and reduced seasonal river flows. Innovative production methods and technologies, such as low-cost greenhouses that help Indian vegetable farmers to conserve water and protect their produce from storm damage, will also be needed to promote long-term resilience.
As policymakers, funders, and researchers address climate change challenges in local, national, and global food systems, it will be critical that smallholder farmers and their community leaders have a voice in identifying solutions through participatory and inclusive planning processes. This report offers examples and recommendations on how to implement a transparent and participatory process for transforming agriculture for climate resilience.
This new WRI report builds on the Global Commission on Adaptation’s flagship report, Adapt Now: A Global Call for Leadership on Climate Resilience. Together, these two reports offer a comprehensive, long-term perspective and recommendations for how to transform global agricultural systems to be more resilient, productive, and equitable in the face of growing climate challenges.


Manish Bapna
Acting President and CEO
World Resources Institute