Traceability and Transparency_TEST

Chapter 4

Availability and usability of data at the point of origin and/or production

This chapter examines the traceability and transparency initiatives, tools, and platforms that make data available about the production circumstances and impacts at commodity origin, and how they are being used by public and private sector actors to avoid forest loss. The chapter looks at the roles and responsibilities of governments, the private sector, financial institutions, and civil society in making data available and usable, and draws out challenges, gaps, and opportunities that are further explored in the following chapters.

Data requirements

Companies, financial institutions, and governments need data to assess, manage, and mitigate the risks and costs within their operations and investments in commodity supply chains. These risks and costs are directly related to the complexity of the supply chain and ease of access to credible information from the point of origin.

Data requirements vary by user, but there are common requirements summarized in Table 5, including meeting commitments by corporations and financial institutions; supporting civil society monitoring, disclosure, and reporting; and complying with market requirements.

Table 5 | Examples of data points at commodity origin relevant to traceability and transparency systems for commodity supply chains

Topic

Examples of data points

Purpose

Location of production areas

  • Location of the production areas, e.g., shapefile of concession/farm
  • Cross-check information with other spatially explicit information related to sustainability aspects
  • Understand risk of encroachment in protected areas
  • Allow for independent verification of sustainability claims, such as absence of forest loss, using satellite imagery, for example

Commodity production

  • References on average production (or authorized production, notably for timber) of the sourcing area
  • Volumes sourced from the region
  • Control of data coherence and identification of leakage risks

Producers

  • Type and number of producers, producer organizations, and intermediaries (structure of the first steps of the supply chain)
  • Map suppliers and related risks regarding the chain of custody

Environmental

  • Rates and locations of forest loss/land conversion
  • Locations of high natural value, for example, with High Carbon Stock or High Conservation Value
  • Cross-check with locations of commodity production and assess environmental or carbon footprint of activities

Social

  • Evidence of slave labor, migrant labor, child labor, occupational health and safety, complaints mechanism
  • Livelihood incomes for farming households
  • Identification of risk of human rights abuses and exploitation, as well as poor pay, prices, or working conditions

Legal

  • Land registration (e.g., CAR in Brazil)
  • Legally protected areas (e.g., Indigenous land, legal reserves)
  • Permits (to produce commodities)
  • Laws pertaining to production and processes of commodities
  • Specific local laws and rights of different stakeholders (e.g., plantation owners and smallholders may have different legal permissions for different activities)
  • Assist governments in enforcing laws that protect citizens from exploitation and environmental degradation
  • For some commodities and contexts, legality is an important precondition and partial proxy metric to assess sustainability and is a requirement for many stakeholders

Ownership

  • Land tenure
  • Legal identity of landowner
  • Evidence of Free, Prior and Informed Consent
  • Rights to access and use the land resource

Note: CAR = Cadastro Ambiental Rural (Rural Environmental Registry).

Sources: Analysis by authors based on Transparency Pathway 2023 and IDH et al. 2021c.

Traceability and transparency systems: Data availability

Table 6 provides examples of traceability and transparency systems that collate, process, and make available data from the point of origin of commodity production. These examples illustrate several key points:

  • Many of the data points on commodity production related to forest loss are already covered by these tools to different extents based on the type of commodity.
  • Availability of datasets for different commodities and across countries varies; gaps exist in commodity coverage (particularly for cocoa and coffee) and frequency of updates (some are not updated annually, see below examples, noting that there are many commercial platforms that provide similar services or build on these tools and initiatives).
  • There are also data points for which data availability is limited (e.g., on land tenure, particularly for smallholders), land use designation, illegality (e.g., illegal forest or other land conversion), and farm/concession boundaries (especially for smallholders but also for other land holdings). In some cases, in the absence of such data, platforms rely on assumptions and/or models to link components of the supply chain.
  • Data needs are constantly evolving, including for whom, by when, and for what. The traceability and transparency solutions developed to date will change in response. For example, there is a growing focus in the palm oil sector on social and human rights issues (e.g., migrant labor, living wages).
  • Different commodity supply chains come with different levels of complexity for traceability and transparency. Factors to consider include presence of smallholders, number and size of farms, prevalence of indirect suppliers, number of intermediaries, resilience of supply networks and supplier relationships, and whether the type of crop can be easily distinguished using earth observation.
  • The cost and resources required to achieve full traceability to the farm level depend on the specific commodity and supply chain, as well as the scale of application (specific volumes within one supply chain, an entire individual supply chain, or volumes of various suppliers). Market and regulatory requirements drive decisions on whether and how to pursue transparency and traceability, including farm-level traceability (see also “Traceability and transparency through the supply chain”) and may require different levels of resources for different commodities.

Table 6 | Examples of traceability systems and tools providing information at point of commodity origin

Tool/system and provider

Data points, sources, frequency

Commodity

Open access/fee based

Use and user

Global Forest Watchaand GFW Prob

WRI and partners

Tree cover and natural forest cover to support emissions monitoring of deforestation and land use change

Combined with public datasets on land ownership for selected geographies worldwide

Land use/land cover change driven by all causes including agricultural and forest commodities (logging, oil palm, wood fiber)

Open access/ launching fee-based premium service based on access to enhanced functionalities to maintain the platform (all data remain open and accessible)

Government agencies, journalists, civil society forest monitors, company users, and financial institutions can track locations or upload areas to generate more actionable insights in support of realizing responsible supply chains

MapBiomas,k

an initiative of the Climate Observatory involving universities, NGOs, and technology companies

Annually maps changes in Brazil’s land use and land cover, using satellite data to a 30-meter spatial resolution (it also operates in Chaco and Indonesia)

Land use/land cover change driven by all causes including agricultural and forest commodities

Open (public), free to access

A wide range of stakeholders including government agencies, companies, civil society, and the media to understand trends in land use change and deforestation

Trasec

The Stockholm Environment Institute and Global Canopy

Combines existing publicly available data on global trade, supply chain facilities, and transport to produce sector-wide supply chain maps for exports

For some commodities, connects supply chain maps to commodity deforestation and emissions in subnational sourcing regions to enable risk assessment

Soy, cocoa, beef, and palm oil, but expanding

Open access

Uses existing data (including per-shipment trade data such as bills of lading and supply chain facilities) to bridge the gap in the middle of the supply chain of international trade, linking consuming countries and trading companies with impacts in production landscapes

Visipecd

National Wildlife Federation, the University of Wisconsin-Madison, the International Sustainability Institute, Amigos da Terra–Amazônia Brasileira

Draws on public datasets already in use by meatpackers in Brazil to close the gap in traceability and monitoring of indirect suppliers to the cattle sector in Brazil

Cattle

Approved users have free access—it was designed specifically for meatpackers and service providers

Meatpackers provide information on their direct suppliers (through CAR identification numbers), which are used by the Visipec tool to identify and assess their indirect suppliers against a range of environmental criteria, including official deforestation data published by the Brazilian government (PRODES) as well as official data including protected areas, Indigenous lands, embargoed properties, and properties with slave labor

RubberWaye

A private company

Wages and working conditions

Environmental/production practices of producers

Information gathered via app-based questionnaire across the supply chainf

Rubber

Fee-based

Can be used by companies downstream in the supply chain using natural rubber to understand social and environmental impacts upstream, and their own risk exposure

FLEGT Watchg

VisioTerra and the Centre for International Development and Training, with funding from the EU and Tropenbos International

Radar imagery from Sentinel 1 satellite

Satellite imagery

Fieldwork, with deforestation alerts checked by ground observers submitting data via an app

Timber

Open access

Used by observers and governments involved in the FLEGT Voluntary Partnership Agreement

Requires “ground truthing” of data

PRODESh and DETERi, j

Brazilian National Institute for Space Research

Used to monitor ecosystems in Brazil, including forest loss and fires

Satellite imagery from PRODES, annual basis

DETER, a newer system, can send deforestation and forest degradation alerts to forest governance actors within a day of a change in forest cover

Commodity agnostic

Open access

Publicly available

Used by government and enforcement bodies, and industry, in Brazil to support the annual monitoring and analysis of the Amazon Soy Moratorium

No link to land registration or other databases (i.e., cattle movements)

Note: GFW = Global Forest Watch; NGO = nongovernmental organization; CAR = Cadastro Ambiental Rural (Rural Environmental Registry); ESA = European Space Agency; FLEGT = Forest Law Enforcement, Governance and Trade; EU = European Union; PRODES = Projeto de Monitoramento do Desmatamento na Amazônia Legal por Satélite (Satellite Monitoring for Deforestation Project for the Legal Amazon); ground truthing = verifying evidence of tree cover loss.

Sources: a. See Global Forest Watch website for further information: https://www.globalforestwatch.org/; b. See Global Forest Watch Pro platform for further information: https://pro.globalforestwatch.org/; c. See Trase homepage for tools, insights, and other resources: https://www.trase.earth/; d. See Visipec website for further information and resources: https://www.visipec.com/; e. See RubberWay homepage for further information: https://rubberway.tech/; f. See RubberWay’s product page to find out more about its mobile application: https://rubberway.tech/our-product/; g. See VisioTerra’s FLEGT Watch page: https://visioterra.org/FlegtWatch/; h. See the PRODES web page for further information: http://www.obt.inpe.br/OBT/assuntos/programas/amazonia/prodes; i. See the DETER web page for further information: http://www.obt.inpe.br/OBT/assuntos/programas/amazonia/deter/deter; j. Bourscheit 2022; k. See Mapbiomas’s website for more information: https://mapbiomas.org/en.

Data ownership and access

Open data

Collating and processing data can be time and resource intensive. Despite this, a significant amount of the data that are relevant to the commodity supply chain and forest risk is freely provided, by both the public and private sectors, such as the following:

  • The United Nations (UN) Comtrade site and the Food and Agriculture Organization’s FAOSTAT offer high-level production and trade statistics for various commodities
  • The National Aeronautics and Space Administration (NASA) and the European Space Agency (ESA) grant public access to data drawn from their earth observation programs
  • Platforms such as Trase and Global Forest Watch are open access
  • The Brazilian government makes PRODES data publicly available through the Brazilian National Institute for Space Research

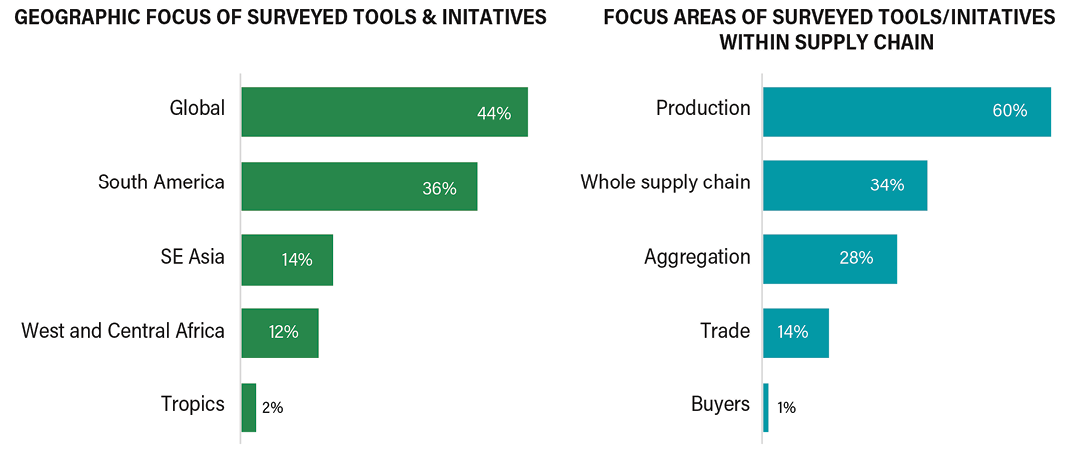
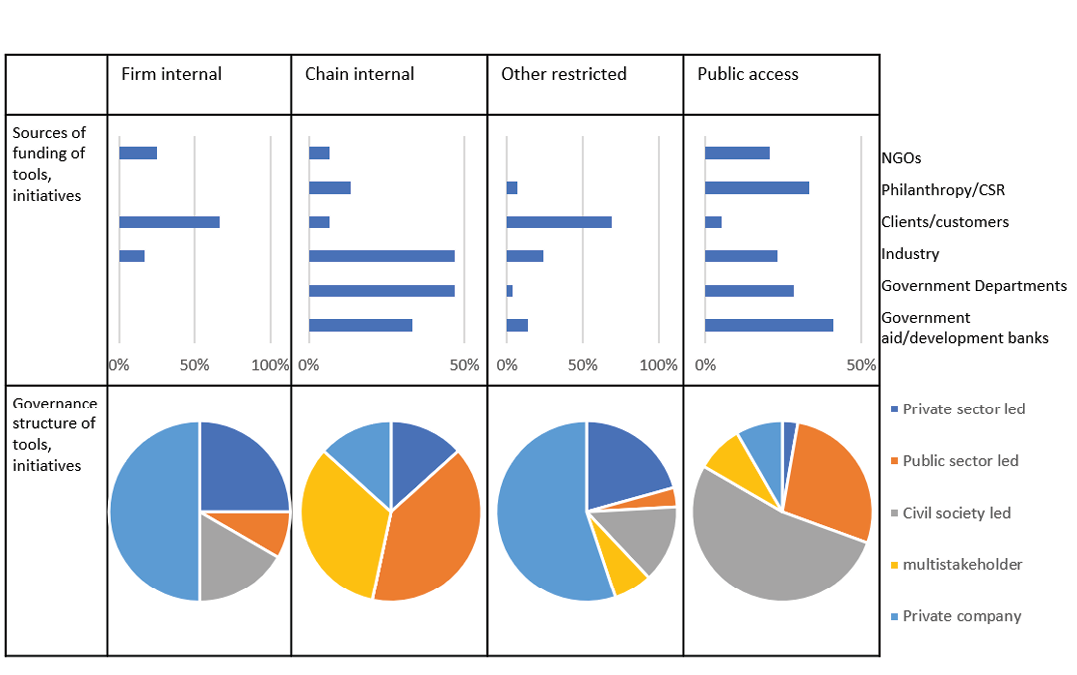
In fact, the global mapping found that 45 percent of the tools and initiatives surveyed provide some data and/or process insights for free, while 41 percent publish all information they produce (see “Results from a global mapping of traceability and transparency tools and initiatives” and Figure 4).

Growing internet access, digitization of information, and access to computing power and expertise mean that the number of open datasets, and the number of people who can use them, continues to grow. The term open data refers to data that are available for anyone to access and use with minimal practical or legal restrictions. Accessibility does not just mean that the data can be found, but that they are easy to use.12 This approach is captured by the FAIR principles—findable, accessible, interoperable, reusable.13 For example, it may be much easier to input data into a program if they are provided in a spreadsheet format rather than pdf format. Ideally, a dataset should be machine-readable so that a program can interact directly with a dataset rather than requiring manual data input.

Microsoft Planetary Computer and Google Earth Engine are currently drawing from these open data sources for their own platforms, which clean and process data and make them accessible for use. The platforms are made usable by a wide range of stakeholders to maximize accessibility and catalyze innovation. The last decade has seen growth in expertise and access to cloud-based computing capacity to process large volumes of data, especially in computer models using methods such as machine learning. Access to this processing power is now widely available with the growth of cloud-based computing services such as Microsoft Azure, Amazon web services, or Google Cloud.

Publishing data and analysis based on open data builds wider trust and accountability, allowing third parties to both check and build on published data to develop more tools and insights,14 which feeds into an “open data ecosystem” (ODH 2016; Kazmaier 2022). This in turn can support greater alignment, decreasing duplicative efforts and enabling harmonized use and impact of data at scale.

The exponential and continuing growth in digital infrastructure means the impact of open data will continue to grow across commodity supply chains. Research by McKinsey & Company estimates that jurisdictions that embrace open data principles will see significant gross domestic product growth (White et al. 2021).

“Paid for” data

Access to data may, however, incur costs. The process of validating, interpreting, hosting, and processing data, and providing new insights and actionable information from raw data (even where the raw data are publicly available), requires human expertise, computational power, and financial resources.

The global mapping showed that around 41 percent of the tools and initiatives surveyed provide access to data and/or insights either only for members or for a fee. A growing industry of private service providers offers paid access to processed data drawn from similar input data sources as used by open platforms.

The question of who owns processed data and the insights delivered is increasingly important. The commercialization of data processing and user-friendly interfaces for decision-makers to handle and interpret information has clear benefits: A market of competing service providers drives innovation that can deliver more helpful insights and thus better information to decision-makers. However, if safeguards are not put in place, commercialization of data gathering, processing, and analysis can exacerbate existing inequalities in supply chains and exclude smallholders from accessing or owning data related to their own operations (Henderson 2021).

Ensuring that ability to pay does not restrict data availability is a central factor to consider, especially when prioritizing public and philanthropic funding, along with data verification and credibility.

What data can be made publicly available and how?

The global mapping highlighted several lessons that present both challenges and opportunities for data disclosure:

  • Data disclosure must respect the need to protect individuals. For example, although the location of both smallholders and plantations might be important to downstream actors, the implications of publishing this information will have different connotations: The smallholder often lives on or near the production area, providing direct access to information about their home to a wide number of people, which is less likely for plantations. There is not yet a universally accepted protocol for protecting the privacy of individuals in supply chains, but various solutions are being developed.
  • Data disclosure must also respect commercial and privacy concerns. More transparency can be achieved by putting in place safeguards to manage privacy while providing data ensuring legal and sustainable production. Regulatory requirements can include such safeguards and still improve information access. Higher levels of trust among supply chain actors facilitate the sharing of more data: What might have been considered sensitive data five years ago is more routinely shared today.
  • Not all data need to be made public to make progress. Within commodity supply chains, even if not all data (e.g., on transactions and actors along a supply chain) are available, it is in many cases still possible using publicly available data to identify priority areas for monitoring forest loss at the point of production, enabling stakeholders to take action to avoid and compensate for forest loss.
  • Data disclosure can build the credibility of traceability and transparency initiatives by enabling external verification. For example, data layers such as the Universal Mill List (Box 3, also see Appendix C) allow third parties to track commodity flows, along with company reporting. This type of standardization is important for interoperability of data disclosure systems. Transparency of one actor to support the traceability of another is a key interdependency and thereby increases the transparency of the entire supply chain.
  • Data disclosure decisions need to consider the trade-offs among the safeguards mentioned above and the benefits that accrue to society when data can be shared.

Box 3 | The Universal Mill List

Private sector operators came together with civil society partners to contribute to an open data ecosystem with the Universal Mill List (UML), which publishes lists of palm oil mills that companies source from. Commercially sensitive data (e.g., on volumes and prices) are not included.

Mills are added to the UML following a standardized methodology developed by WRI and Rainforest Alliance that uses high-resolution satellite imagery to manually verify the presence and location of mills.

The UML standardizes the identifiers used by actors for different mills by assigning a universal identification (ID). This single list and ID system applied across multiple platforms and providers allows for easy cross-referencing among mill lists and enables third-party monitoring.

Source: GFW 2022.

The role of governments

Data already made available by governments

Governments collect, manage, and in many cases make datasets publicly available to support a range of public and private sector initiatives, including on land use, land cover, production systems, land tenure, and other features. Not all relevant datasets are available to the public, however.

What datasets to make available and according to what definitions can be a matter of contention and a critical dimension of land governance. For example, information on boundaries of concessions (e.g., for timber, palm oil) are available at varying levels of clarity, consistency, and usability in different countries, and disclosure of such information by actors other than government agencies has been challenged. Ensuring consistency in land use maps is difficult, especially where land use is managed by different ministries and where there are overlapping responsibilities among ministries. This is something that many countries are seeking to resolve, for example, through One Map in Indonesia.15

There are some data that the private sector and civil society could collect but with significant time and cost investment. In these cases, governments may be better placed to collate and share data, especially where there is a risk of duplicating efforts or there is a lack of commercial incentive to cover certain areas or sectors that may be more remote or create higher costs. These costs cannot necessarily be absorbed by government agencies without external funding. For example, in the case of concession boundaries and land use of forest and agricultural commodities—for oversight of commodity production, forest monitoring, encroachment into protected areas, and tracking production without permits—governments can make the information available more efficiently than other actors collecting the same information. Alignment among the government, the private sector, and civil society on roles and best practices for data gathering efforts could help establish more consistency and coordination and help avoid duplication of efforts.

Opportunities to improve data interoperability

Efforts to align definitions and reporting formats when publishing data on forest loss and sustainable commodity production can improve the interoperability of different data disclosures. Such alignment can also help build the credibility of data outputs and analysis derived from them, while noting that different data-gathering protocols and analysis methods among actor groups will continue to produce different results. As such, datasets from official and external sources may contradict each other.

Data formats, definitions, and metadata are essential. According to developers of open data platforms, a lot of the work that goes into generating actionable insights from public datasets lies in cleaning and transposing data to make them usable with computer models, and compatible with datasets from other sources. Ensuring that data are published using agreed formats, definitions, underlying methods, and metadata could reduce the cost of producing insights from open data and greatly increase their impact.

An agreed data framework for managing data would cover dimensions such as metadata, interoperability, quality, and architecture and make it easier to manage data. Such a data governance framework (Earley et al. 2017) presents a mechanism through which entire sectors can decide what data to collect and publish. This requires input from those who hold data, usually in the private and public sectors, and those in civil society or expert consultancies, who tend to know what data are needed and how they can be fully used.

Traceability and transparency: Data usability

Maintaining the information flow across a supply chain is a precondition for establishing a traceability system. One challenge lies in linking products to origins across the supply chain, including navigating discrepancies among organizational systems for data collection and incentives. Another major challenge relates to data usability. Data are useful only when they can be shared in a format that provides users with insights supporting better decision-making. Companies driving market demand, which may be subject to regulatory obligations, are often far removed from the point of production and have limited resources and expertise to make sense of data. Data do not, by themselves, have any impact—how data are used makes the difference.

The global mapping showed that 26 percent of the tools and initiatives that share data do not generate new data but derive their outputs wholly from existing datasets. These tools and initiatives focus on collating, processing, and sharing existing information to make it more accessible and usable. One example from the Brazilian beef sector is Visipec (see Appendix B), which compiles and synthesizes existing data from various public sources to enable monitoring of cattle supply chains to expand to indirect suppliers, and analysis of property-level socio-environmental risks.16 Another is SPOTT, which takes public information about various companies involved with palm oil and timber to produce sustainability ratings that investors can use to inform their decisions.17

Role of earth observation technologies to monitor land use change

The capability, accessibility, and use of earth observation to monitor land use change grew exponentially in the last decade, including optical and synthetic aperture radar. The capabilities and ongoing research and development for these technologies are discussed in more detail in “Innovation and direction of travel of technological applications for traceability and transparency.” High-resolution images are publicly accessible with increasing periodicity from public and private sector providers. Some examples of these tools are detailed in Table 6.

Insights from these tools can be used by companies and financial institutions to assess their supply chain risks and impacts, and inform the development of strategies to mitigate those risks and contribute to solutions on the ground. Companies use alerts to target resources and incorporate earth observation methods into their traceability and transparency systems to flag areas of concern for follow up. Civil society actors use tools based on earth observation in combination with other sources of data, such as customs data (e.g., Trase18) or registered production locations (e.g., the Cocoa Accountability Map19), to highlight the connection between global supply chains and forest loss to hold companies to account and to call for action.

Some of these tools have systems that provide publicly accessible, near-real-time alerts of tree cover loss such as the integrated deforestation alerts available on Global Forest Watch (Weisse and Pickens 2020). These alerts provide an early indication of where tree cover loss may be occurring so that enforcement officers, local communities, and advocacy organizations can respond. See Table 7 for a list of early warning deforestation alerts offered by Global Forest Watch. In addition to these integrated alerts, complementary sources of information exist with the RADD (RAdar for Detecting Deforestation) alerts, which are based on weekly ESA Copernicus data (see Box 9 in “Innovation and direction of travel of technological applications for traceability and transparency“).

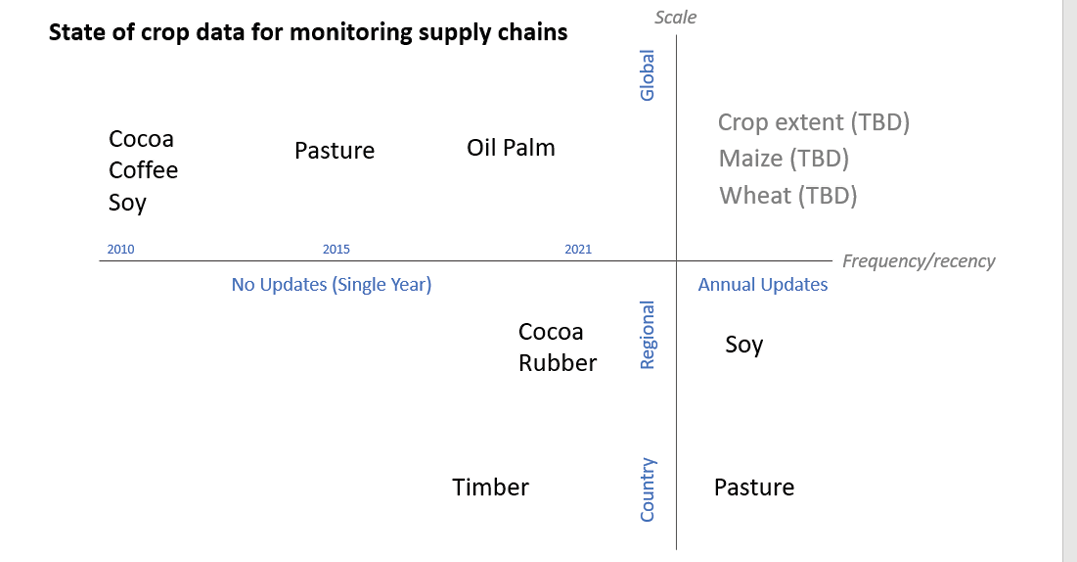
The ability of earth observation to distinguish among land cover types is improving rapidly. Some crop-specific datasets exist (see Appendix H), but some crops are easier to map than others because of limitations of earth observation. For instance, identifying shade-grown crops such as coffee or cocoa in agroforestry systems is much more challenging than identifying oil palm plantations. Appendix H and Figure 5 provide an overview and visual summary, respectively, of the availability of datasets on crop extent and whether the datasets are one-off mapping efforts or updated annually. The public availability and coverage of spatially explicit datasets on crop extent is constantly developing. For example, a new dataset on cocoa in Ghana and Côte d'Ivoire is available in Kalischek et al. (2023); a new dataset on oil palm and pulp and paper plantations is available in Gaveau et al. (2022); and Wang et al. (2022) contains a new dataset on rubber and is currently in pre-print. “Innovation and direction of travel of technological applications for traceability and transparency” includes more information on ongoing research to improve crop mapping based on earth observation.

Figure 5 | Availability of crop data for monitoring supply chains

Source: Goldman 2022.

Table 7 | Overview of deforestation alerts offered on Global Forest Watch

System

Geographic coverage

Resolution

Frequency of updates

Other details

GLAD-L (Global Land Analysis and Discovery – Landsat)

Tropics (from 30 degrees north to 30 degrees south)

30 meters

Every 8 days

Covers a wide variety of landscapes to detect loss in any type of tree cover, including plantations

GLAD-S2 (Global Land Analysis and Discovery – Sentinel 2)

Amazon basin

10 meters

Every 5 days

Detects change in humid tropical primary forests

RADD (Radar for Detecting Deforestation)

Humid tropics

10 meters

Every 6-12 days

Penetrates cloud cover to detect change in humid tropical primary forests

Integrated deforestation alerts

Tropics (from 30 degrees north to 30 degrees south)

10 meters

Upon source systems’ updates

Detects change in primary forests as well as plantations as well as younger forests

Source: Adapted from Berger et al. 2022.

Limitations of earth observation tools

While use of earth observation has clear benefits, there are technical limitations too:

  • Identifying natural forest (Mazur et al. 2023b) and vegetation types (e.g., distinguishing among managed grasslands and pastureland or inter-cropping cocoa or other commodities within forests)
  • Monitoring cocoa, coffee, and other shade crops that are not easily visible from space, and so are more difficult to monitor. Technological solutions have been developed that may fill in some of these gaps (again see “Innovation and direction of travel of technological applications for traceability and transparency”).
  • Interpreting the causes and intended uses of observed land use change—e.g., distinguishing between legal and illegal forest loss, between human-induced and natural tree cover loss, and between temporary tree cover loss and deforestation through land use change and determining if a commodity was eventually planted on a parcel of cleared land, which can include an expanded time horizon. As discussed above, drawing conclusions on the causes of forest loss is likely to require other information at origin, such as knowledge of land ownership and farm or concession boundaries, to identify whether encroachment into forest area observed though satellite observation complies with local laws. While data on land conflict, human rights violations, and information related to labor and legal compliance are often not geospatial, there is an urgent need to collect these types of data at a global scale.
  • There is a need for “ground truthing,” or verifying evidence of tree cover loss, to help interpret earth observation data and to collect sample points for training models. For example, in Guyana, drones have been used to supplement earth observation to provide a baseline mapping and monitoring of forest cover for the government of Guyana’s climate commitment.
  • Earth observation data on their own do not provide the information needed to trace products back to origin, which requires research and mapping on suppliers. However, earth observation data can be combined with information about commodity origin to assess sustainability and legality claims through remote sensing data.
  • One limitation of commodity datasets and the myriad tools that deploy them is that these data can’t be compared on different platforms, constraining users’ ability to effectively apply these data to their specific needs. Within the Forest Data Partnership, partners are currently working to increase the interoperability of existing public datasets, drawn from satellite data and other sources, and cross-check their validity with pre-competitive ground validation data to verify what the satellites show on the ground. This may be provided from a variety of sources including research establishments, civil society, and others such as the High Conservation Value Resource Network.20

Bringing datasets together to enhance usability for decision-makers

Data triangulation from a variety of sources into a form useful to decision-makers is a major innovation area. Examples of this (identified in Table 6) include Visipec, Selo Verde, and Trase.

Carrying information from origin downstream (through to retailers and brand owners) in a meaningful way requires further innovation to link datasets at origin into supply chain tools, and relates to challenges of traceability and transparency systems within supply chains (see “Traceability and transparency through the supply chain”). Innovation in this space will determine whether it will be possible to meet market demands for full traceability and transparency through supply chains to the point of origin.

Lessons

  • Technical advances including the ability to handle large datasets through cloud-based platforms will continue to improve the quality and usability of data and close current gaps (e.g., enabling better distinctions between natural and planted forests, managed grasslands, and pastures). “Innovation and direction of travel of technological applications for traceability and transparency” looks further at current innovations addressing these gaps.
  • No one dataset can provide a full picture of the situation at origin. Different datasets need to be used together and be aligned with each other to make sense of the situation and enable better decision-making.
  • Many tools and initiatives are available only after paying for access. Cost or resource constraints should not prevent actors/users, particularly smaller and vulnerable actors, from accessing tools and platforms.
  • Evolving market and regulatory requirements are driving an increasing need for full traceability and transparency throughout supply chains for downstream companies to the farm level, including all smallholders.
  • While there are gaps in data availability at the point of origin and limitations on earth observation data if not complemented by traceability data, another challenge of equal significance lies in carrying data through the supply chain and making them available in a way that can be used by decision-makers.
  • Solutions to support making data available in a useful format will require innovations in the way datasets across supply chains can be linked, and the way data can be presented.
Start reading