Traceability and Transparency_TEST

Chapter 3

Results from a global mapping of traceability and transparency tools and initiatives

Short intro paragraph goes here. Magnimostibus autet officiet eos sunderume rectorum qui rerferiani dolent et, sus et undiatat.Berit unt mo que dest repernam, nos doluptatur as experis dem ipsam idebita ped quate nus sunt. Eruptint quibus, comnimint aut et di numquo qui tota eat lam, odio vendempost que ipicipis dolo etus est experio eos molorum, quae laccae pa ad qui dis enis se consed magnat.

Stock-take of traceability and transparency tools and initiatives: Key findings

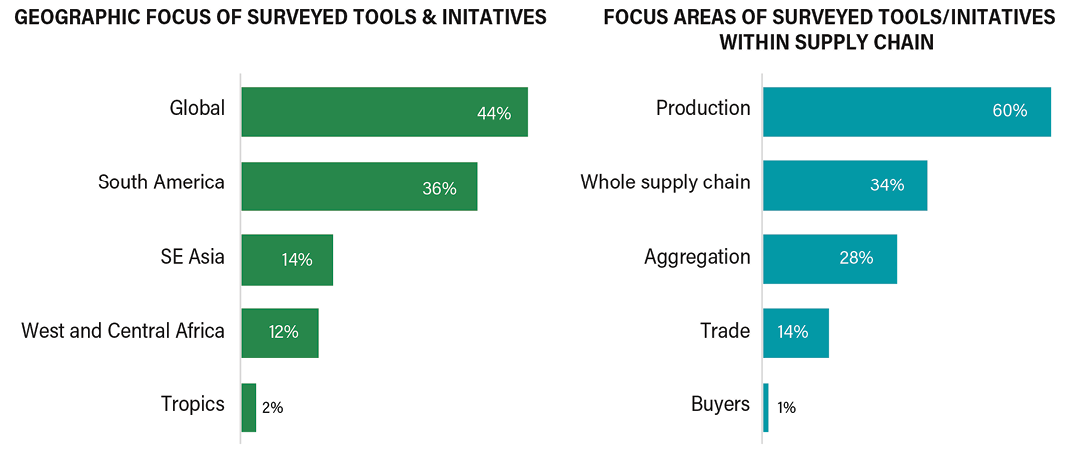
We carried out a mapping survey of 94 tools and initiatives focused on the six commodities most associated with forest loss: palm oil, soy, timber, cattle, cocoa, and coffee. Rubber was not in scope at the time of the mapping survey, but we have provided examples in the rest of the report. Additionally, we carried out a survey of published evaluations on the effectiveness of these tools and initiatives, which is discussed in “Operational and funding models.”

The tools and initiatives reviewed focused on palm oil, soy, cattle, timber, and cocoa, with less coverage of coffee and rubber. Tools and initiatives exist in country, regional, and global applications, recognizing the global nature of these commodity supply chains, but may focus on different sections of supply chains.

Figure 2 | Coverage of global mapping survey: Geographic focus, in terms of regions of production of surveyed tools and initiatives (left), and focus areas of surveyed tools/initiatives within supply chains

Source: Authors.

Definitions of traceability and transparency

We carried out the mapping to help identify the interdependencies and enabling conditions that affect the usage and potential impact of traceability and transparency tools and initiatives. To do so, we examined the approaches taken in traceability and transparency tools and initiatives. However, during the literature review, no consistent, precise definitions of the terms traceability and transparency were seen to be universally used.

In fact, there was much overlap in the usage of the two key terms. For example, transparency may refer to the ultimate aim of being able to see through a whole supply chain—for all required information about a supply chain to be available and to be shared externally and internally (Bateman and Bonanni 2019). Under this definition, traceability, related to the preservation of information about a commodity as it moves through a supply chain, is required to meet full transparency. However, a simple definition of transparency is also sometimes used, referring to the simple act of disclosing information (i.e., being able to see into the operations of one stakeholder) (AFi 2020a). Under this definition, a stakeholder could be fully transparent about its operations by disclosing that it has little information on traceability in its supply chain and no targets or policy to change this, so under this definition transparency and traceability could be wholly distinct concepts. However, an upstream company being transparent and disclosing such information may aid in the traceability of a downstream company and therefore help its decision-making in terms of choosing whom to do business with.

Thus, in the process of generating information and placing it in the hands of decisions-makers, the choice of how to define exactly which parts of this process count as traceability or transparency is not consistent across the sector. Unfortunately, this can slow efforts to align, coordinate, and amplify the work of stakeholders working in different contexts related to commodity-driven forest loss. This inconsistency, or lack of clarity and understanding, has been recognized, and Table 2 gives sources that outline workable definitions of traceability and transparency.

The broad working definitions for this report, detailed in “Traceability and transparency: Research objectives,” were chosen to balance the work that has gone into scoping more rigorous definitions, presented in Table 2, with the common uses that are seen in the literature, and to provide some level of distinction between transparency and traceability.

Table 2 | Examples of definitions of traceability and transparency

Term

Sources

Summary and definitions given

Supply chain transparency

Gardner et al. 2019.

This report defines supply chain transparency with the aim of improving sustainability aspects on the ground as being composed of six information types relating to traceability, transactions, impacts, policy and commitments, activities, and effectiveness. It also identifies 10 gaps in information availability, and gives guidance on how transparency efforts can make positive impacts.

Traceability

IDH et al. 2021c.

This paper gives an overview of traceability definitions and evaluations relevant to cocoa in West Africa. It proposes a new traceability definition as consisting of three parts—the origin, the steps cocoa takes through a supply chain, and links to sustainability characteristics. In this report, “cocoa traceability systems provide a foundation for improving transparency along value chains” (p. 5).

Transparency

Mol 2015.

This paper discusses the role of supply chain transparency in the wider context of sustainability and democracy. Four levels of transparency are defined relative to where an organization is sharing information: management transparency (upstream actors sharing with downstream actors), regulatory transparency (sharing with regulators or inspectors), consumer transparency (sharing with certification bodies and consumers), and public transparency (open disclosure).

Transparency

AFi 2020a.

In the context of making a credible process of monitoring and verification for a supply chain, transparency is defined as stakeholder engagement and public disclosure of information including policies and methodologies related to traceability and grievances.

Transparency

Bateman and Bonanni 2019.

This paper defines the level of transparency of an organization along two axes: One axis relates to the level of availability of information about supply chain relationships, policies, and practices, while the other relates to the depth to which information availability extends into the supply chain.

Source: Compilation by authors.

Furthermore, Table 3 gives core elements of traceability systems that we identified during the research process. Not all systems include all elements, depending on the scope and purpose.

This report treats transparency not so much as a system with components but the process of sharing data and information under certain conditions, which applies to both traceability systems and other contexts for collecting and sharing data.

Table 3 | Key elements of traceability systems for monitoring risk of forest loss associated with production of commodities

Key elements of traceability

Description

Objective

  • Purpose
  • Target users of traceability information (e.g., government, private sector, civil society)

Scope

  • Geography
  • Commodity
  • Supply chain stages
  • Specified characteristics (e.g., legality, sustainability, deforestation or forest degradation impacts, qualification as deforestation-free, presence of certification)

Governance structure

  • Monitoring and oversight over the system, based on purpose and audience
  • Internal or external leadership

Mechanism to control commodities through the chain of custody

  • An approach for physical management of commodity volumes (e.g., mass balance, segregated, identity preserved)

Conformity requirements and assessment framework

  • Defined metrics for success

Monitoring framework

  • Defined inputs: Data needs, sources, definitions, guidelines, reporting flow, and framework
  • Defined outputs: Characteristics of data to be shared between successive steps of the supply chain
  • Control mechanisms

Data: Management approach, including privacy and integrity

  • System for data collection and maintenance of data that corresponds to the purpose (see “Objective” above)
  • Systems for quality management of data
  • Rules for data sharing among players along the supply chain
  • Data-sharing processes (including practical aspects and tools)
  • Safeguards for managing commercial sensitivities and compliance with data privacy protection laws

Data: Interoperability and usability

  • Alignment on definitions, methods, and what constitutes credible evidence
  • Data in a format and with context that enables decision-making on the defined purpose (see “Objective” above)

Assurance and verification

  • Monitoring accuracy of assessment
  • Validation of data and identifying and correcting errors in the system
  • Assurance models: First-party assurance, second-party verification, or external third-party verification, corresponding to system objective

Reporting systems

  • Transparency of data, methods, and system components

Source: Compilation by authors.

Functions of tools and initiatives

Using the working definitions as given in “Traceability and transparency: Research objectives” for the 94 tools and initiatives covered in this mapping survey, 72 can be described as primarily to do with traceability and 22 can be described as primarily to do with transparency. However, many tools that provide traceability may also provide an element of transparency in that they may or may not provide information to stakeholders beyond the direct users of the tool. Therefore, for this initial delineation, we define transparency initiatives as those primarily developed to catalyze information sharing or make existing information more usable, while traceability tools and initiatives are those that primarily aim to help stakeholders using the tool or partaking in the initiative understand the flows of commodities and impacts of their production.

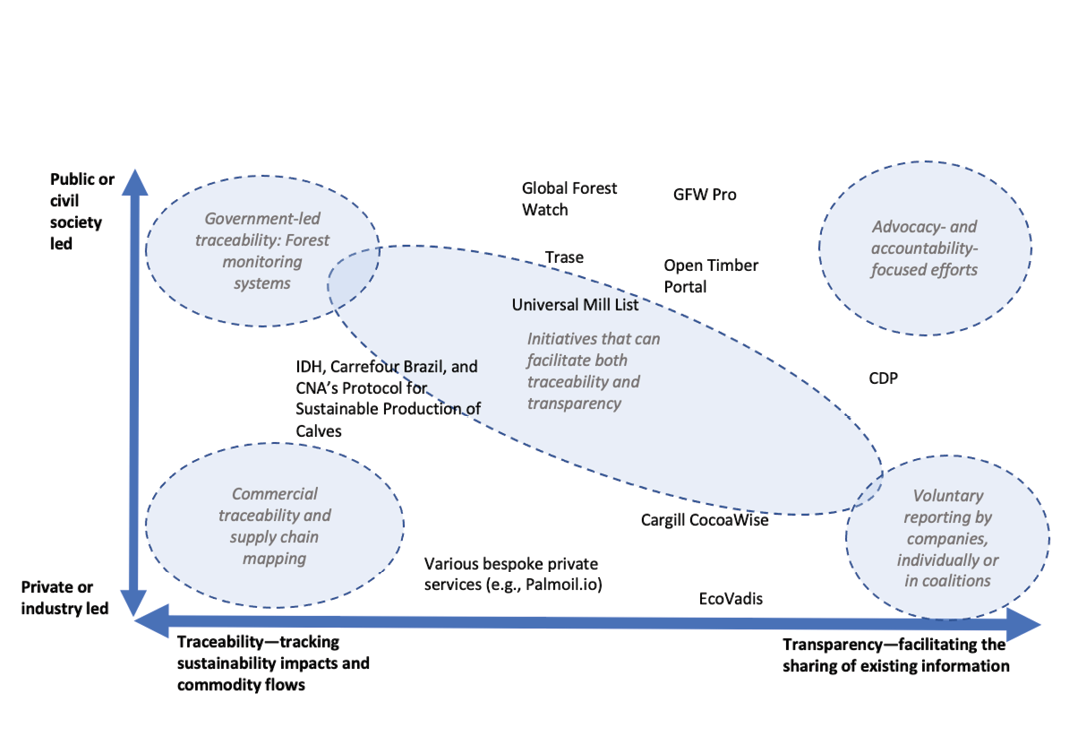
Figure 3 shows one way to categorize the tools and initiatives and highlights the area of overlap between traceability and transparency.

Figure 3 | Categorization of traceability and transparency tools and initiatives

Source: Analysis by authors.

To further investigate the functions and use of tools and initiatives, we categorized them according to the type of information they provide and the level of transparency with which this information is accessible. The categorization used draws from the work presented in Table 4 to identify key features of traceability and transparency, but is not presented as a new definition or analytical framework that this report advocates to be universally applied. Instead, this is a way to understand what the tools and initiatives produce information about, how they help stakeholders use and share information, and who can use this information.

The four broad categories into which tools and initiatives were grouped are as follows: those that generate data about production circumstances or trade flows of commodities; gather and/or process data into more easily accessible or decision-ready information for different audiences; provide a disclosure mechanism for stakeholders to communicate private information; or share information (i.e., this tool or initiative can be used as an information source for interested stakeholders—this was further broken down into the level of transparency of this information).

Most tools and initiatives fit into more than one of the above categories. For example, Trase uses processed satellite data to generate new spatial datasets about land use for different commodities; processes existing data (e.g., producing models of trade flows drawing on sources such as customs data); and shares information through reports and an online platform. The vast majority of tools shared information that they produced. Information was shared with varying degrees of transparency. A low proportion of tools facilitated third parties sharing information by providing disclosure mechanisms. Those that did not share data were often frameworks to guide stakeholders in generating or sharing their own information, such as the Global Reporting Initiative and Accountability Framework initiative. Likewise, some initiatives were focused on building capacity to facilitate greater traceability or transparency.

We provide a more thorough breakdown of how these categories, and further subcategories, vary with each other and with funding and governance models in Appendix A, while key findings informed by this survey are illustrated in the below sections.

Of the tools and initiatives in the sample that generate raw data, over 70 percent produce new data to track the sustainability impacts of commodities at the location of production. Of these, 66 percent draw from satellite imagery. This reflects the effort invested in building a clear idea of what may be driving forest loss, and the dominant role that remote sensing now plays in informing stakeholders of on-the-ground impacts.

However, a significant number do not generate raw data. Of the tools and initiatives that share data, about 26 percent do not generate any raw data, deriving their outputs wholly from existing datasets. Of those that both generate data and make information relevant to sustainability impacts available, 78 percent also draw on other existing datasets (e.g., publicly available data or data available for a fee) to supplement or contextualize newly generated information. Tools using information on land ownership and adding satellite-based deforestation alerts to inform estimations of company exposure to deforestation risk are a common example. In summary, tools that share on-the-ground insights focus on how to use data that already exist, as well as on the creation of new data. This reflects the value that can be drawn from reusing and combining existing, available data in innovative ways to produce or infer usable insights.

Through the supply chain—data transfer and usability

Data generated about the origins and movements of commodities are generally processed into information that improves the capability to assess risk of production upstream, including through sustainability ratings of companies or production areas, as well as more actionable information on commodity flows.

Forty percent of surveyed tools provide outputs focused on commodity flows. Given the drivers for traceability and transparency outlined in the introduction, this is not surprising. However, tracking commodity flows can be subject to commercial sensitivities, as businesses may not want to disclose details of their trade with third parties, and be technically complex. For example, and as discussed further in “Traceability and transparency through the supply chain,” products from different origins with different sustainability characteristics can be mixed or processed into new products (e.g., palm oil derivatives, or poultry products coming from soy-fed chickens) at several points in the supply chain, while traveling through different legal jurisdictions and through the custody of various companies.

Governments in producing countries develop national traceability systems for certain commodities within their borders. However, stakeholders operating from downstream in global supply chains may also have to trace through international trade and through stages of the supply chain post-import, so by the time a product reaches them it may be hard to link the information they have about a product with data from systems based in the producing country. Tracking within a supply chain is often undertaken by companies themselves or within closed membership groups, highlighting the commercial sensitivities of data sharing.

There are a growing number of private consultancies offering supply chain mapping and risk assessments that are core components of a traceability and transparency system, often to larger corporations. These partnerships between expert consultants and private companies often see the combination of the companies’ internal logistical or procurement data with data generated by the consultancy (e.g., through satellite imagery or other accessible datasets, such as customs data) to build assessments of whole supply chains and environmental impacts.

Data availability, cost, and funding

As mentioned above, almost a third of the tools that share information do not generate new data, only collate, process, and re-share existing information. There are tools and initiatives that release data or process insights for free (45 percent of surveyed tools), and there are many that share this only with initiative members or within a supply chain (17 percent) or for a fee (33 percent).

Collation and sharing of information are often services charged to users of the data, often including their own company-relevant data. This charge to users represents both the level of effort and expertise required, and the tangible financial value of such insights. There is a growing industry commercializing information generated from data that are freely available by processing data into usable forms. This could imply that many published datasets are not fully or properly used by stakeholders (see “Data ownership and access” and “The role of governments” for a discussion on data sharing and utilization). A lack of usage could, for example, be partially due to a lack of resources, technical expertise, or access to computing power among stakeholders who could best utilize existing datasets—a motivating factor behind the development of Global Forest Watch’s Small Grants Fund.9

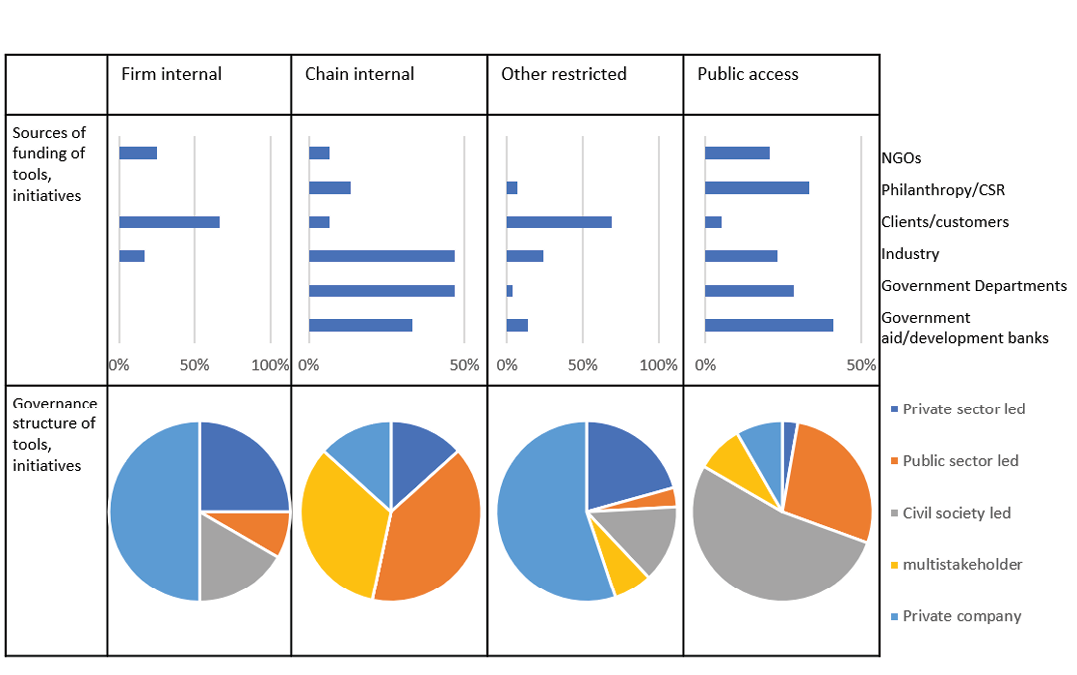
However, the level of transparency10 appears to correlate with the funding and governance models of the tools (see Figure 4) and with different objectives. For example, those that are most transparent or are entirely focused on transparency tend to be led by civil society, and although these tend to have diverse or mixed funding sources, almost 90 percent of them have as primary funding sources governments of the countries they operate in, government foreign aid, philanthropies, or nongovernmental organizations (NGOs). That is not to say that different stakeholders have different or opposing agendas, but it could imply that different aspects of traceability and transparency work are most effectively carried out by different stakeholder groups. Likewise, this could imply that a sustainable funding model, obtained, for example, through fees or donations, is a key factor in determining the level of transparency of tools and initiatives. This is discussed in “Evaluation and effectiveness of traceability and transparency tools.” In addition, tools set up to trace products for a company have different objectives than those that assess company performance, which focus more on accountability.

Figure 4 | Tool/initiative transparency levels and funding/governance

Notes: The above figure shows how the level of transparency of surveyed tools/initiatives varies by funding source and governance structure. Each column shows a breakdown of funding sources (top row) and governance structures (bottom row) for a specific level of transparency. For example, most tools/initiatives that restrict access to information to a single entity or organization (termed firm-internal transparency) are funded by clients/customers, and three-quarters are either governed as a private company or private sector led; Many tools/initiatives receive funding from more than one sector, and different tools and initiatives may share different levels of information with different audiences, so total percentages can sum to more than 100; CSR = corporate social responsibility.

Source: Analysis by authors.

Operational and funding models

Tools and initiatives can be set up in a range of operational and funding models, including off-the-shelf solutions or systems developed by internal or external experts. Funding sources can include external funding from donor agencies or private philanthropies, internal funding through government or other revenue allocations, or a mix of both. Depending on the scope, purpose, and complexity, cost can vary widely. In the forest sector, the upfront development of government-owned traceability systems in Latin America was found to cost as little as $300,000 and as much as several million US dollars. However, it is difficult for external analyses such as this report to assess the cost of system development since there are frequently several government agencies involved and costs are not usually published or shared (Stäuble et al. 2022).

When deciding on whether to develop a system in-house or hire external system developers, system owners should consider several factors, including the complexity of the planned system and in-house capacity, relative cost, and how long-term maintenance and upkeep of the system can be performed and funded. In either case, the system owner needs to develop the knowledge, capacity, and commitment to maintain the system in the long run (Stäuble et al. Forthcoming).

There may also be a correlation between motivation and system sustainability. In the case of government-owned systems, agencies in charge of funding and maintaining systems set up with external financial assistance can face issues finding long-term support for system upkeep. Governments that decide to develop and implement a system with their own resources in some cases can also show more long-term ownership over the system. However, the context varies widely across system owners and countries. In either case, funding models need to be considered at the outset, including sufficient funding for maintenance and upkeep of the system over time, including potential additional development costs to respond to the evolving data landscape, whether through user fees or fines generated by the system itself, or from external sources (Stäuble et al. Forthcoming).

Box 2 summarizes considerations related to funding models for timber traceability systems developed by governments, which can provide lessons for other types of tools and initiatives, as analyzed by an upcoming WRI publication (Stäuble et al. Forthcoming).

Box 2 | Considerations for determining funding models for government-owned timber traceability tools and initiatives

The funding scenario of a government-owned traceability tool can have different types of implications. Donor-funded systems could face an increased risk of escalating development cost and/or an underestimation of the running cost because the availability of external funding can lead agencies to plan for more ambitious and complex systems. In some cases, a base amount of public funding can increase ownership of the implementing agency.

Systems that rely on one funding source are more vulnerable to losing funding over time as priorities shift. A mix of funding sources can help manage this risk.

Funding models include the following:

  • System-generated income, consisting of the cost of compliance, royalties collected via the system, penalties issued for noncompliance, and the perceived risk of conviction. Systems that rely only on this type of income can be vulnerable to accusations of misuse, and can also go through budget challenges if payments are not collected in a timely manner.
  • Donor funding frequently supports initial system development but in most cases does not cover operational costs. In some instances, donor interest may focus on supply chains leading to export markets, which could leave domestic markets behind.
  • Public funding, which would ideally not stem from agencies that benefit from compliance or noncompliance with the system to avoid real or perceived conflict of interest, which may undermine trust in the tool. Systems relying entirely on public funding are vulnerable to budget cuts due to financial crises or other economic developments.

Since systems are never “finished,” they incur development and maintenance costs over time that are required to ensure that the system remains fit for purpose. These factors should be considered in the funding plan.

Source: Stäuble et al. Forthcoming.

Evaluation and effectiveness of traceability and transparency tools

Much attention has been placed on ensuring the accuracy of the data available in these traceability and transparency tools through rigorous, peer-reviewed, methodological research. However, very little has focused on the impact (measurable change for forests and people) of the tools that employ these data. Without such evidence it is not possible to establish a clear causal link between the use of traceability and transparency tools and improvements in natural resource management, nor is there evidence about the effectiveness of tool features or conditions.

This leaves unanswered questions about, for example, the most useful data types, minimum standards on data quality, best tool design, most effective dissemination methods, and more. Without robust answers, this lack of knowledge has real consequences: There is a risk of wasting valuable and limited resources by duplicating efforts to analyze, combine, or deliver data and insights; there is a risk of confusing key stakeholders with competing information or creating unnecessary reporting burdens that are not useful; and a risk of delivering data in ways that will never contribute to decision-making because they are not accessible or usable, or because the necessary enabling conditions are not in place.

While our review of tool evaluations was not exhaustive, it indicates that few tools have implemented ways of measuring the impact of open data or drawing lessons about the best way to deliver such information.

Findings

Of the 94 tools and initiatives covered in the global mapping, 85 percent have not conducted, or at least have not publicly shared, evidence that their work is effective in preventing commodity-driven deforestation or supporting other environmental impacts. Though this doesn’t mean these tools aren’t effective or impactful—some tools indeed do offer anecdotes or user stories as examples of their potential usefulness—these few examples do not amount to a clear signal, nor are they strong evidence on which practitioners can base future projects. Our findings illuminate a missed opportunity to learn from advances in data science to create the biggest impact.

The importance of evaluating tools and initiatives

Investing in impact evaluations of traceability and transparency tools offers opportunities to gather clear evidence, allowing stakeholders to better align around fewer tools that are most effective, and therefore to provide consistent information across more users and sectors. Better information about the most effective tools would make it possible to more efficiently allocate resources to increase adoption of data for decision-making in key user groups. Impact analysis could lead to more effective tools providing rigorous evidence that does the following:

  • Demonstrates causal links between the availability of certain data and outcomes for forests, carbon sequestration, or other natural resources
  • Compares data delivery mechanisms in meeting the unique needs of stakeholders in diverse geographic and social-political contexts
  • Identifies key enabling conditions to increase the effectiveness of tools
  • Illuminates gaps in causal chains between data availability and outcomes for forests
  • Explores unintended consequences of tools

Where evaluations have been conducted, they provide valuable lessons for the future funding of tools, selection of data, and tool-dissemination strategies. Some of these valuable findings are presented in Table 4.

Table 4 | Examples of impact evaluations of traceability and transparency tools

Tool

Finding

Response

Global Forest Watch, GLAD Alert subscriptionsa

A 2021 evaluation found that subscriptions to GFW’s freely available forest change detection led to an 18% decrease in the probability of forest loss in Central Africa and that subscriptions have a stronger deterrent effect in areas where a policy framework is present, such as protected areas and forest concessions.

This evidence supports decisions to invest in freely available alert systems, indicates a successful delivery method that could be scaled to include alerts of various types, and creates an imperative to fund work to integrate them into local policy frameworks.

SISBOV—Brazilian Service for Traceability of the Cattle and Buffalo Production Chainb

A 2012 evaluation found that farmers were not satisfied and would not use the SISBOV system because it posed a cost that they were unlikely to recuperate through higher prices. This held even when farmers recognized that the system provided useful information.

These findings could highlight the importance of cost-effectiveness even in technically effective systems, or instigate a rethinking of the funding structure.

World Cocoa Foundation Climate Smart Cocoa Initiativec

An analysis of the World Cocoa Foundation initiative to share transparent information on climate interactions of agricultural practices found that providing a cost-benefit analysis increased the likelihood that farmers and lenders would adopt practices that could mitigate climate effects and improve livelihoods.

These findings provide evidence for the future direction of farmer information systems, and in the capacity of farmers and lenders to interpret that information.

Note: GLAD Alerts = Global Land Analysis & Discovery Alerts; GFW = Global Forest Watch; SISBOV = Serviço Brasileiro de Rastreabilidade da Cadeia Produtiva de Bovinos e Bubalinos (Brazilian Service for Traceability of the Cattle and Buffalo Production Chain).

Sources: a. Moffette et al. 2021. See also Jamilla n.d., a case study on the lessons learned from an impact assessment of GFW; b. Furqium and Cyrillo 2012; c. Bunn et al. 2019.

Challenges to be addressed

Barriers that are often cited as reasons why evaluations have not been undertaken include cost, time, expertise, and challenges in accessing information. Allocating funds for an impact evaluation could be a low priority, especially in the face of the significant costs of handling large datasets and web or app development.

Time poses a unique challenge because the generation of data on land use change can be slow and some datasets are gathered only annually, so determining impact may take years. In many cases, forest loss is due to multiple factors, and it may be difficult to isolate the impact of one factor such as a traceability and transparency system.

Expertise may also play a key role; evaluation and research of traditional sustainable development work often looks at a limited target population to determine the impact of interventions. Traceability and transparency tools, however, do not normally have such a clearly defined target audience. Many are available to anyone with an internet connection, which makes it difficult to understand who uses the tool and for what purpose, and to associate changes in the environment with the use of the tool. The global survey of tools done in this research found almost half of tools and initiatives offered some level of access free of charge (see Appendix A). Assessing the link between access to data and outcomes for forests and people is a new and unique research challenge that may require new methodologies, which in turn require greater investment. Some projects, such as the Forest Data Partnership,11 are addressing this need for integrated research, from tool inception and development through user application.

While these barriers are not insignificant, the lack of evidence available to support continued investment in data and tool development could limit the potential of the field to tailor and scale its impact.

Lessons

The global mapping—drawing on interviews, case studies, literature, and a survey of tools and initiatives—has shown the enormous diversity in function, funders, and users. It highlights different priorities and barriers to meeting traceability and transparency and the needs of different stakeholders in ensuring that information in the hands of decision-makers leads to reduced forest loss. The following is a compilation of key themes identified through the mapping.

  • Funding, ownership, access, and use of data: Alongside the need for more data, there are often issues around ownership and accessibility/use of data for all stakeholders (including smallholders), the question of who is funding the provision of that data, and the sustainability of the funding sources.
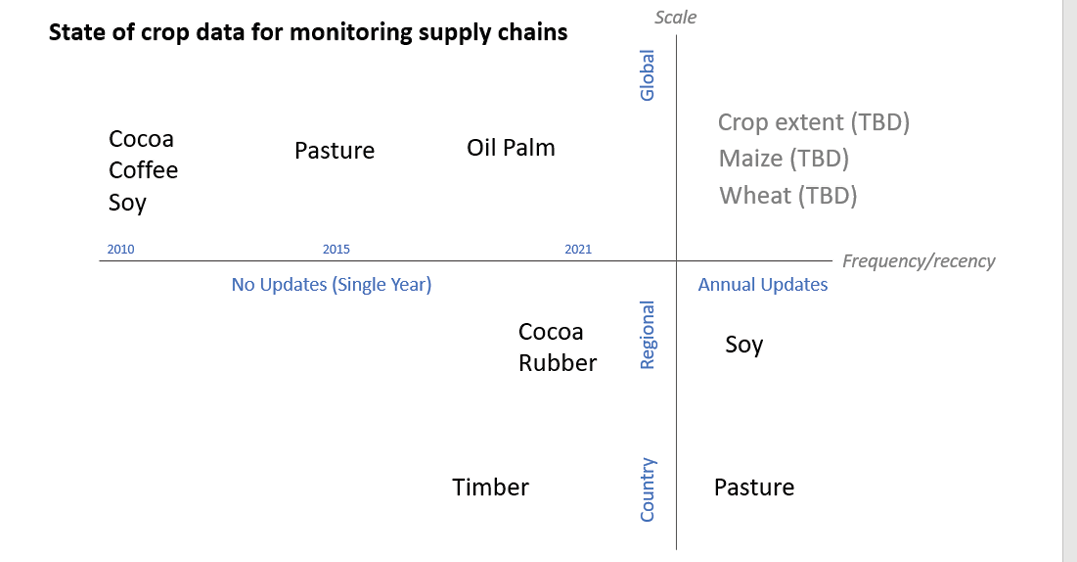
  • Relevance and quantity versus quality of data: The mapping survey showed a wide range of tools generating or outputting data that, at face value, cover different parts of a supply chain or monitor the forest of certain regions. However, other factors identified during stakeholder interviews and in wider literature that dictate whether those data are useful include the quality of that data source—for example, the granularity and completeness of the data, frequency of publication (i.e., annually, monthly, or daily), or time lag between data generation and publication.
  • Providing improved data is not sufficient to impact forest loss: Data must be usable in real-world supply chain management and decision-making, thus enabling stakeholders to implement and act upon information. Data generated, and information disclosed, must provide decision-ready information for those seeking to improve the environmental impact of commodity production and trade. This can mean, for example, that different published datasets are usable together to build a larger picture.
  • Scaling up of successful projects: The mapping survey revealed effective traceability systems from many geographies and commodities. However, through stakeholder interviews it was understood that several of these successful projects have not been able to scale up to achieve significant coverage of a supply chain or be translated into systemic changes to provide improved traceability to the whole supply chain or region.
  • Most (85 percent) of the tools and initiatives have not conducted, or at least have not publicly shared, rigorous evidence that their work is effective in preventing commodity-driven deforestation or supporting other environmental impacts.
  • Motivations for engaging in traceability and transparency and metrics for success: Initiatives to improve transparency and traceability are very diverse in the organizations involved (from trading companies to smallholders to NGOs), in the specific reasons for their formation (e.g., to react to market pressure or to comply with legal requirements), and the metrics that are used to define and measure success.
  • The enabling environment can be very influential in providing the motivation to act and determining the likely scale, depth, and durability of any initiative. Enabling conditions are often specific to geographical or sectoral circumstances. Critically, they can determine the likelihood that the intended impacts, such as reduced forest loss, are achieved. Understanding the context within which the tools or initiatives are developed (by whom, for whom, and why) as well as understanding their function (in terms of data inputs and outputs, or transparency level) can be critical in understanding the success of a particular traceability or transparency tool/initiative.
Start reading