Highlights
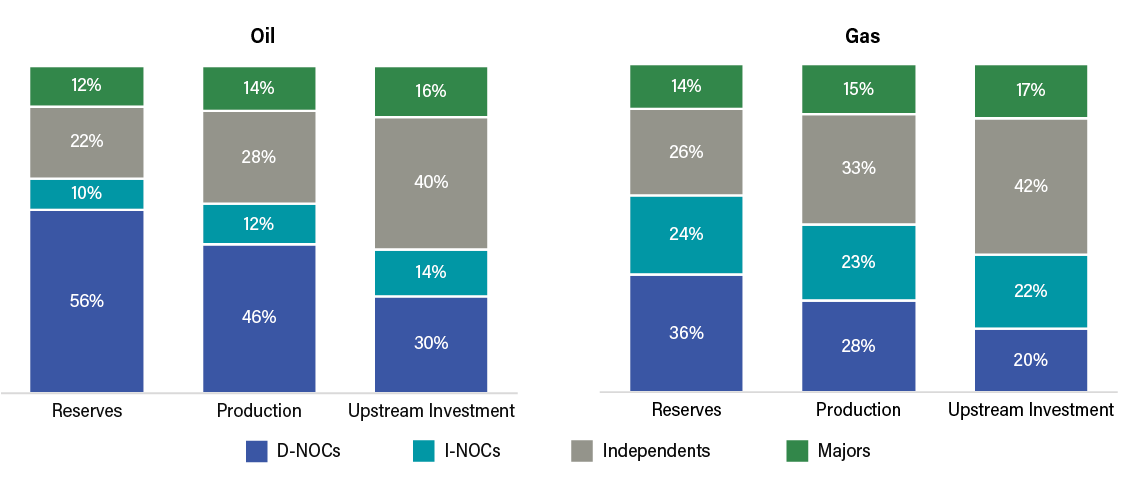
- Oil and gas production plays a major role in many middle-income developing countries by supporting local economies and jobs and generating sizable government revenues.
- Periodic market volatility and mounting global pressure to achieve net-zero carbon emissions by midcentury raise questions about the sector’s stability and long-term future.
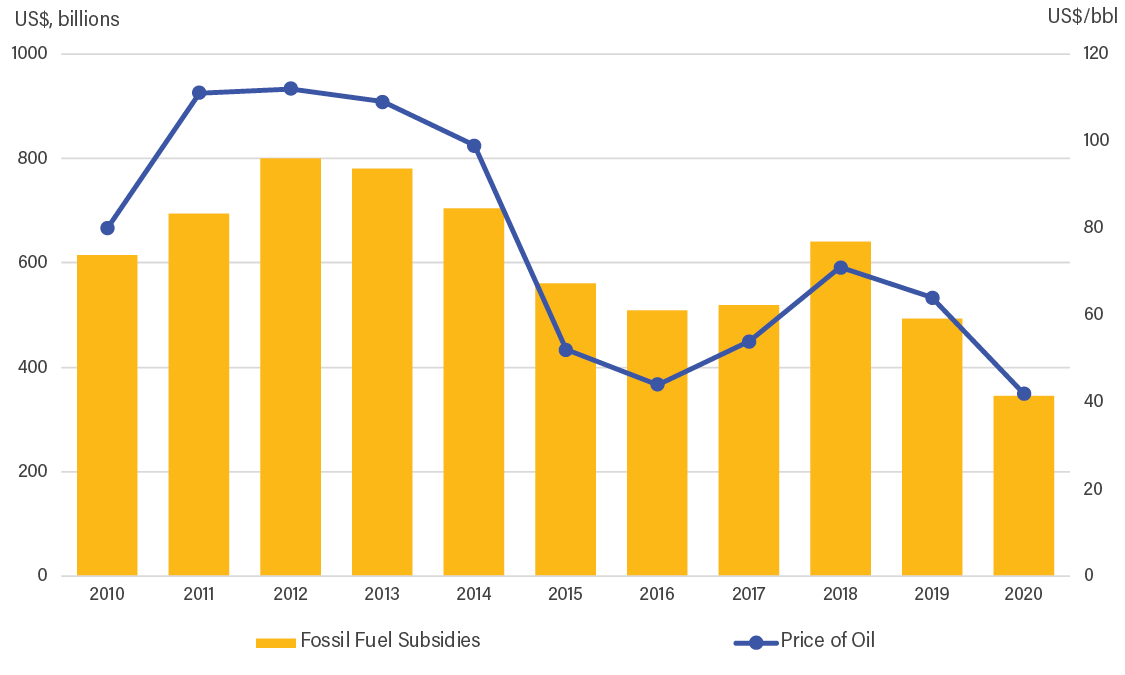
- Although shifting away from fossil fuels is beneficial, phasing down oil and gas production over the coming decades will cause significant revenue loss for middle-income countries that produce these fossil fuels, with implications for public spending on social programs and infrastructure, public sector employment, and fossil fuel subsidies for vulnerable groups.
- Though the oil and gas industry is not typically a major direct employer, it generates large numbers of indirect and induced jobs that are often geographically concentrated, with outsize influence on subnational governments (SNGs) and local communities.
- Other characteristics of this workforce, including varying unionization rates, the presence of large numbers of contract workers, relatively high pay, and low female participation, will be essential to consider for a just energy transition.
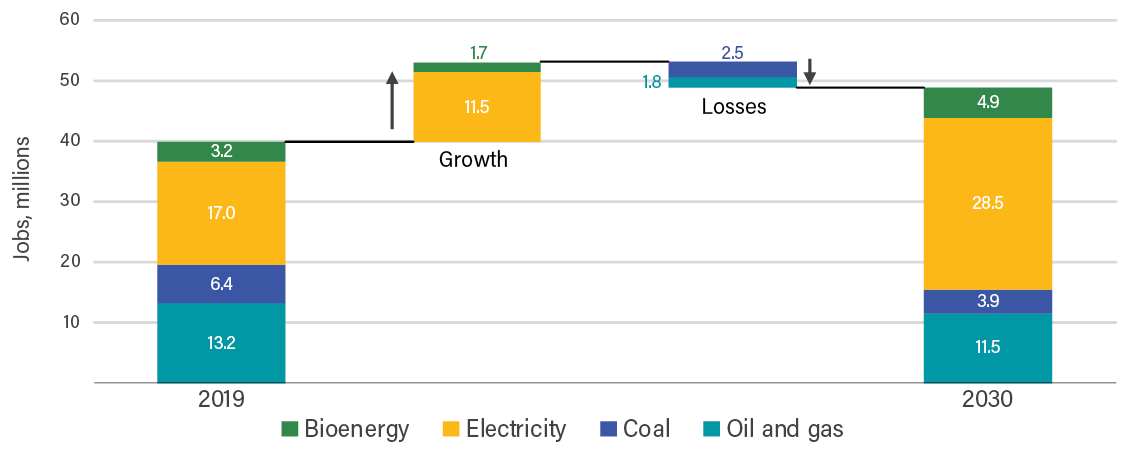
- The challenges of transitioning away from oil and gas can be mitigated by prioritizing place-based economic diversification to generate alternative revenue sources and new jobs, including in the clean energy economy, and developing just transition strategies to aid impacted workers, communities, and SNGs.


