EXECUTIVE SUMMARY
Highlights
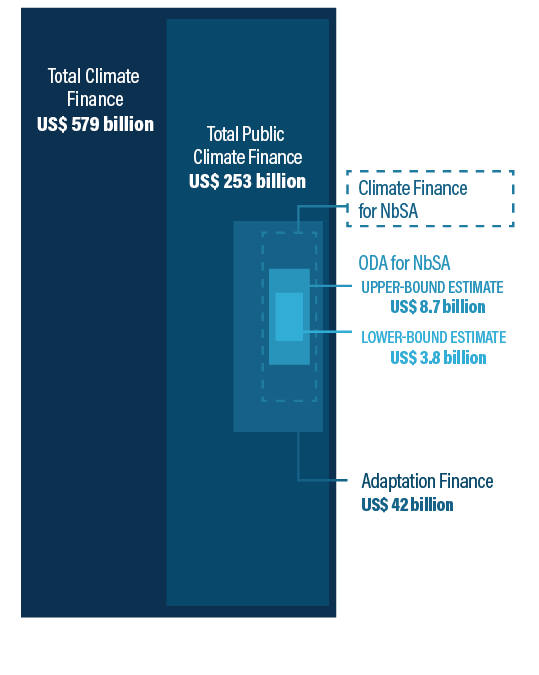
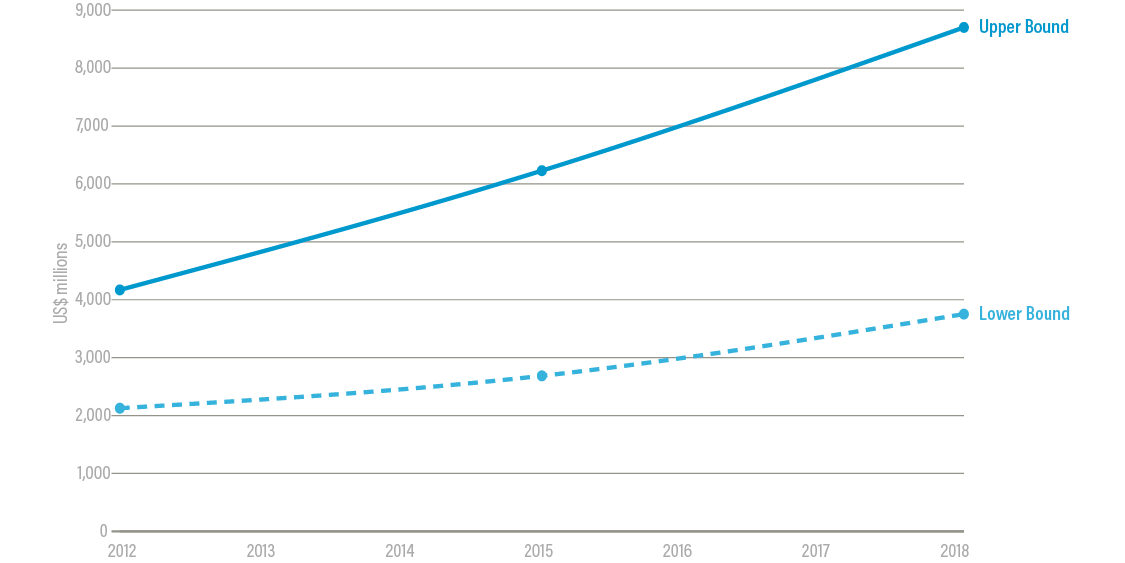
- Overall, the amount of public international funding flowing to nature-based solutions (NbS) for adaptation is still relatively small, accounting for only US$3.8–8.7 billion, or approximately 0.6–1.4 percent of total climate finance flows1 and 1.5–3.4 percent of public climate finance flows, in 2018.
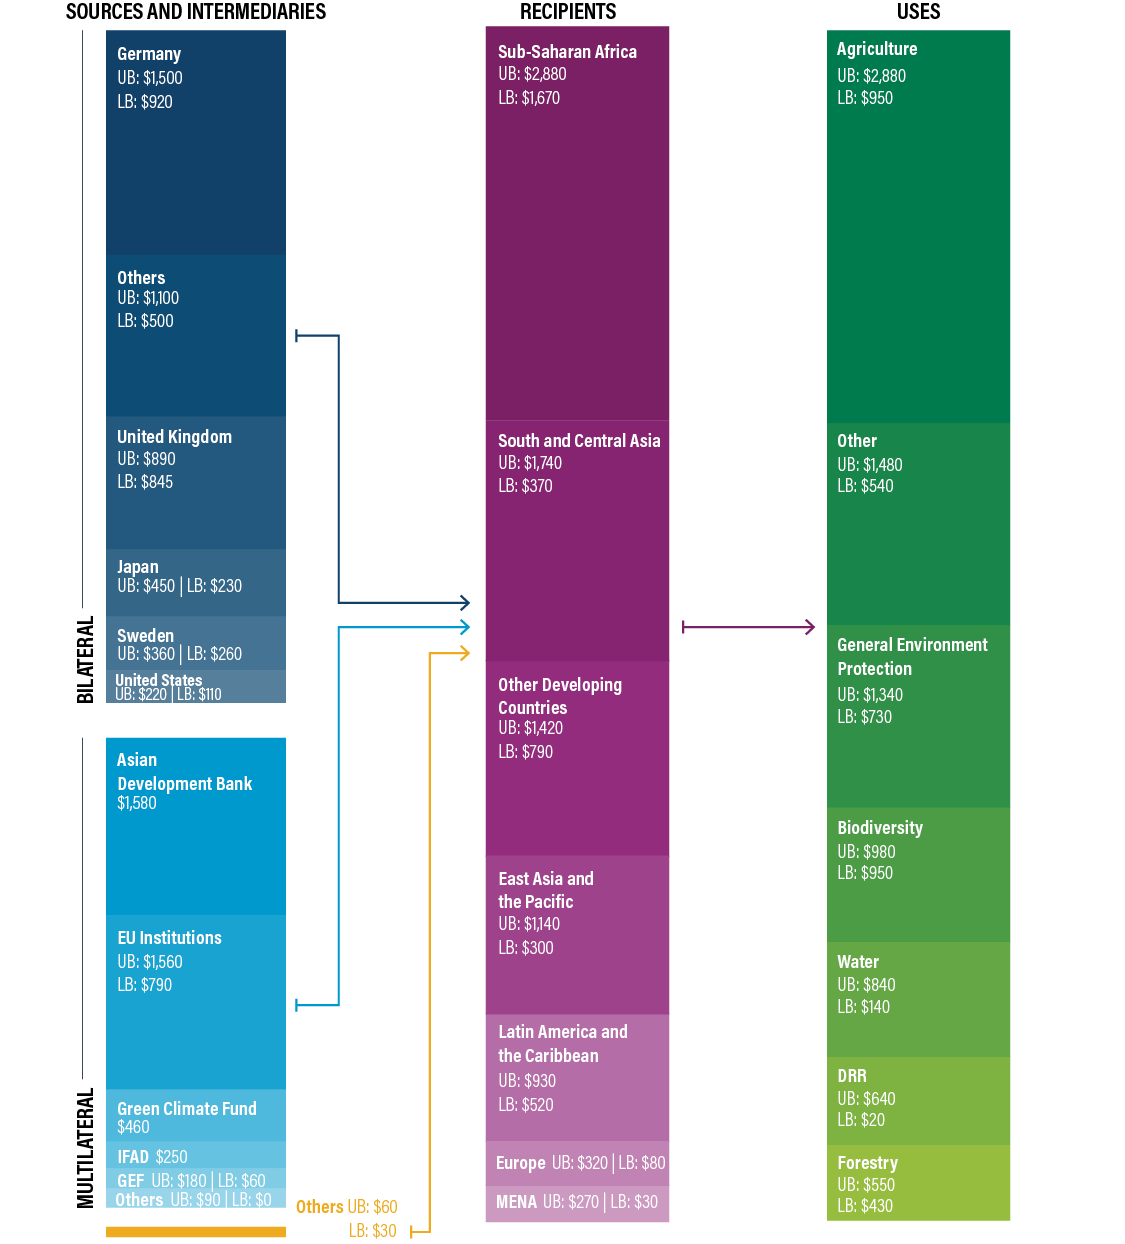
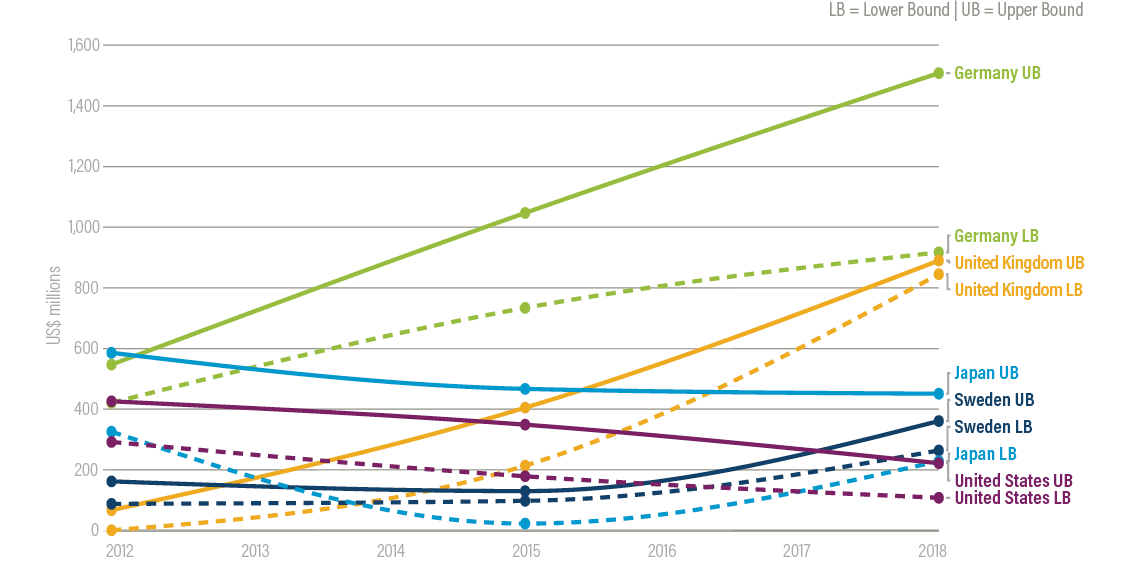
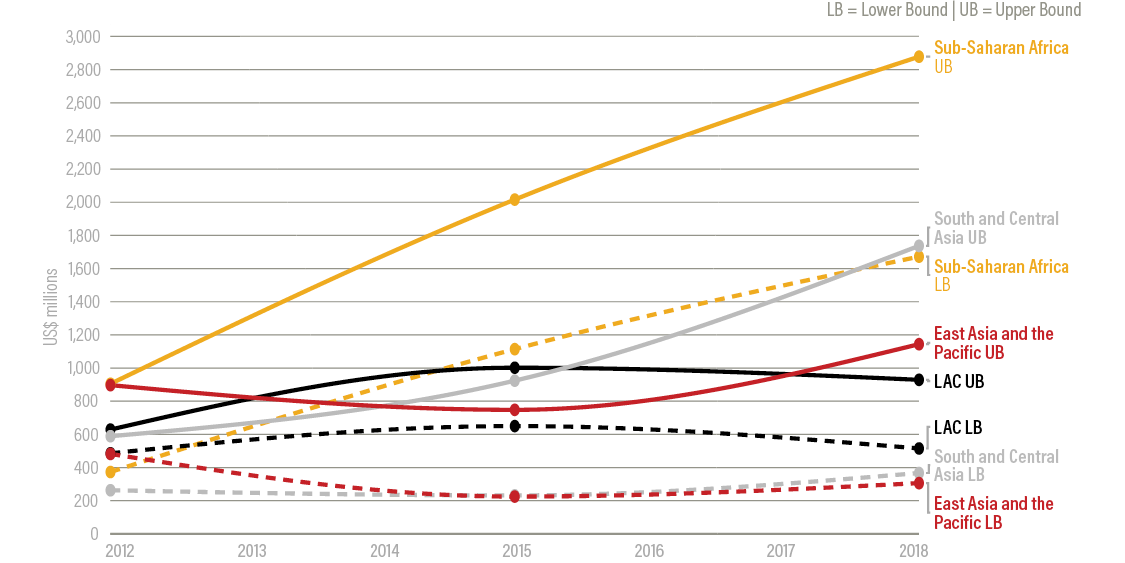
- Funding for NbS for adaptation (NbSA) in 2018 was driven by a handful of major bilateral donors, including Germany, the United Kingdom, Japan, and Sweden. The European Union, Asian Development Bank, the Green Climate Fund, and the International Fund for Agricultural Development were among the largest multilateral donors and channels of funding. Countries in Sub-Saharan Africa and South and Central Asia received approximately 50 percent of total public NbSA funding.
- Funding in 2018 came primarily through grants. Though grants may play an important role, utilizing a broader range of instruments for NbSA may increase the opportunities to crowd in and catalyze private capital with public concessional finance.
- The absence of clear definitions, guidelines, and metrics and methodologies to track, quantify, and value NbSA benefits may significantly inhibit the development and financing of a robust pipeline of NbSA-related investments.
- Some NbSA projects do not provide reliable revenue streams, making it important to find other ways to fund long-term operational costs. To scale up and mobilize additional sources of funding, the full economic and financial case for NbSA—including cobenefits—needs to be clearly communicated.
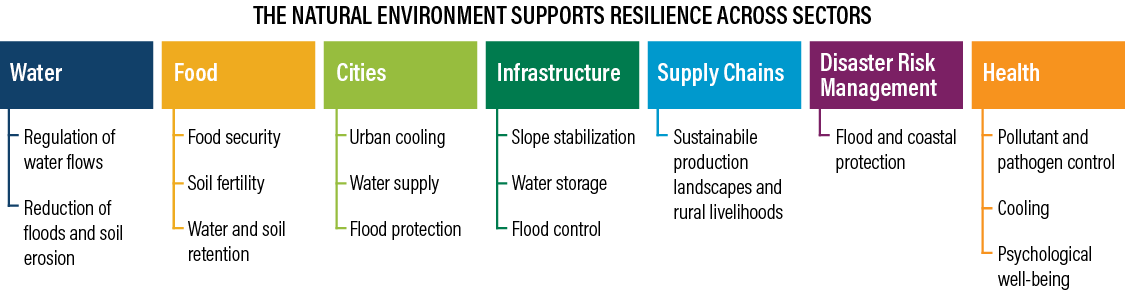
The 2019 flagship report Adapt Now: A Global Call for Leadership on Climate Resilience by the Global Commission on Adaptation (the Commission) identified access to finance as one of three key barriers that impede the scaling up of NbSA in many countries. NbSA encompasses several different types of activities, investments, and approaches that seek to protect and restore nature and ecosystems for the services they provide to human society.2 Although various funding sources may exist, an individual country’s ability to access them depends on a range of factors, including readiness and capacity, knowledge, and foresight to plan NbSA investments and the skills to finance such investments. For many developing countries, these efforts may be further complicated due to overall economic challenges and those now resulting from the COVID-19 pandemic. Meanwhile, interest in NbSA investment is changing quickly, with new actors, approaches, and investors seeking opportunities to invest in newly emerging NbSA in recent years.
NbSA investments will be fundamentally important in helping many countries address climate change. In almost all circumstances, public capital will be highly valuable. Climate finance and official development assistance (ODA) will be important to help developing countries scale up such investments, particularly where national public budgets may be constrained. Furthermore, because of the range of development and other benefits that NbSA can bring, integrating such approaches into post-COVID economic recovery planning can maximize the effectiveness of international and domestic public funding while delivering long-term resilience.
Demand exists. Seddon et al. (2019) showed that more than 60 percent of countries recognize the need to preserve ecosystems and have included NbS into their first nationally determined contributions (NDCs). Likewise, a similarly high number of countries acknowledge that protecting ecosystems and enhancing biodiversity is a key goal of their adaptation planning efforts.
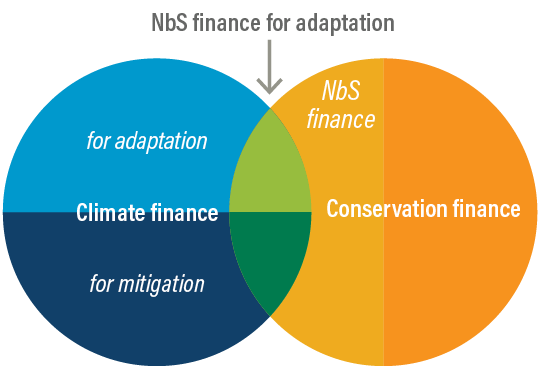
This paper provides the first assessment of the landscape of public international funding (climate finance and ODA) for NbSA and seeks to help donor and developing countries better understand the current state of funding flowing for NbSA. The findings in this paper are based on an assessment of funding flows as well as interviews with key stakeholders, such as donors, climate finance funds, multilateral development banks, and countries.
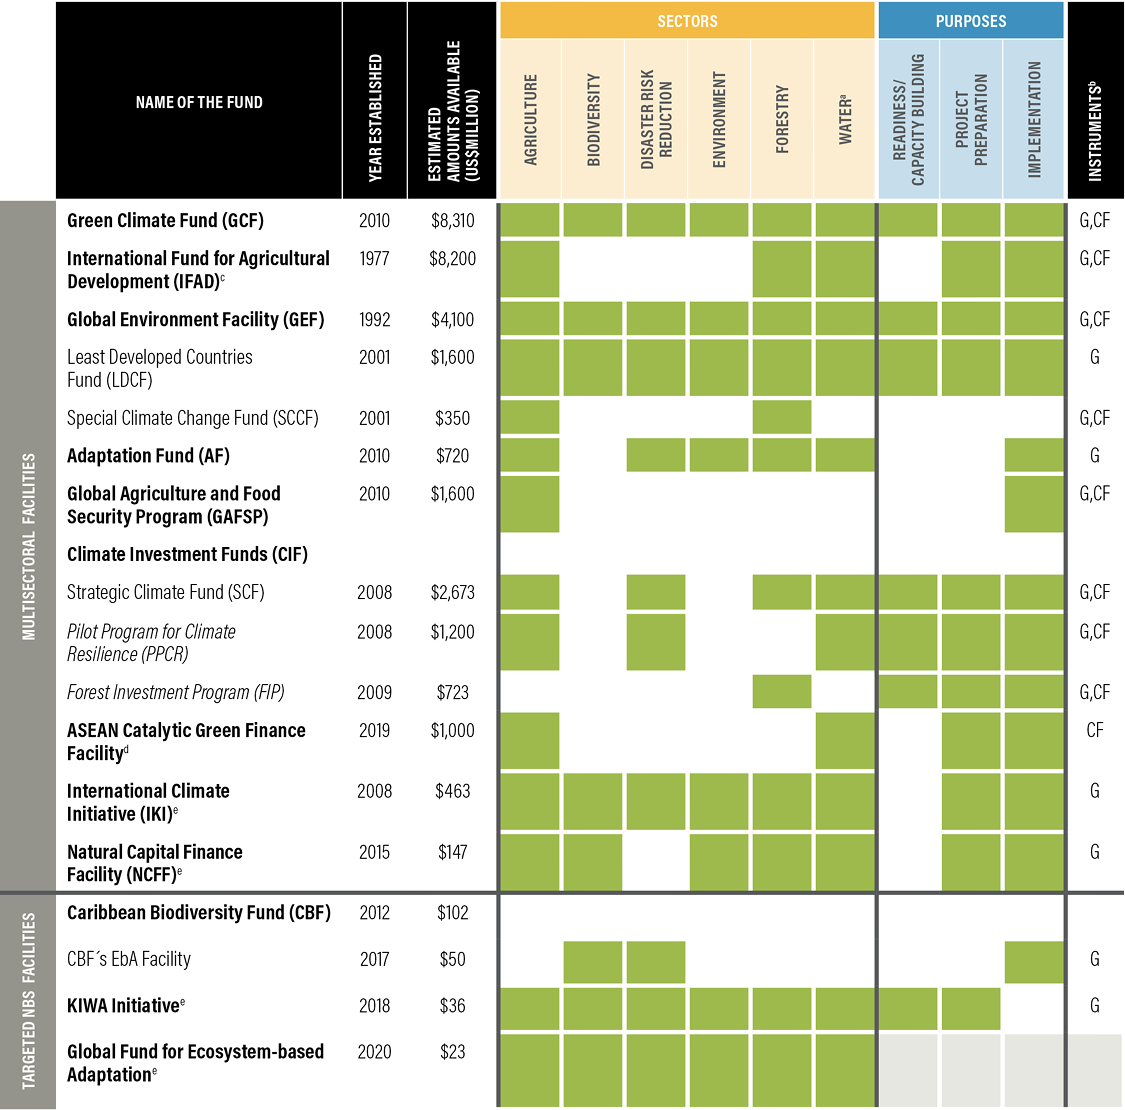
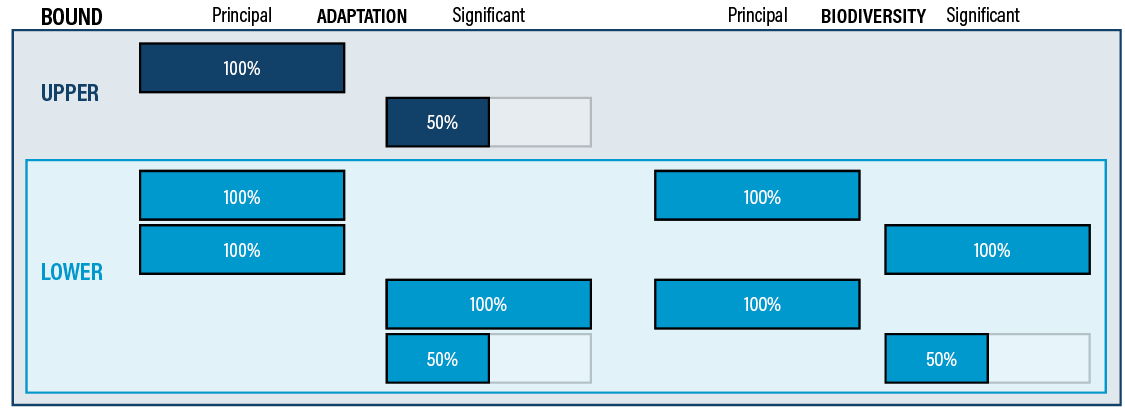
The landscape assessment has some very important constraints. It covers only public international funding (not domestic budgets), and estimates are based on imperfect tagging within the data sets analyzed. Because the data sets analyzed do not explicitly tag NbS or NbSA, the authors tracked funding from sectors that most commonly align with NbSA, such as forestry or water. The assessment, therefore, is unlikely to capture all funding for NbSA. (More detail on the methodology can be found in Appendix A.)
The figures cited as the most definitive measure of total climate finance flows come from the Climate Policy Initiative (CPI) and include public, private, and some south-south flows. CPI’s figures provide context for the NbSA estimates in this paper because their tracking is the most common citation for international and policy discussions around climate finance.3 This landscape assessment covers only public international funding. It shows that in 2018 public international finance for NbSA was estimated to account for $3.8–$8.7 billion—or 0.6–1.4 percent of total climate finance flows, 1.5–3.4 percent of total public climate finance flows, and 9–21 percent of adaptation flows4—and relative to more than $140 billion per year in adaptation investment needs in developing countries (UNEP 2021).5 Furthermore, CPI estimates that total funding for both adaptation and mitigation in the “agriculture, forestry, land-use, and natural resource management” sectors in 2018 only accounted for 3 percent of all tracked climate finance or 7 percent of tracked public finance (Buchner et al. 2019). Although not entirely comparable due to the mitigation activities in these sectors, this figure is often referenced as a data point to indicate overall NbS flows.
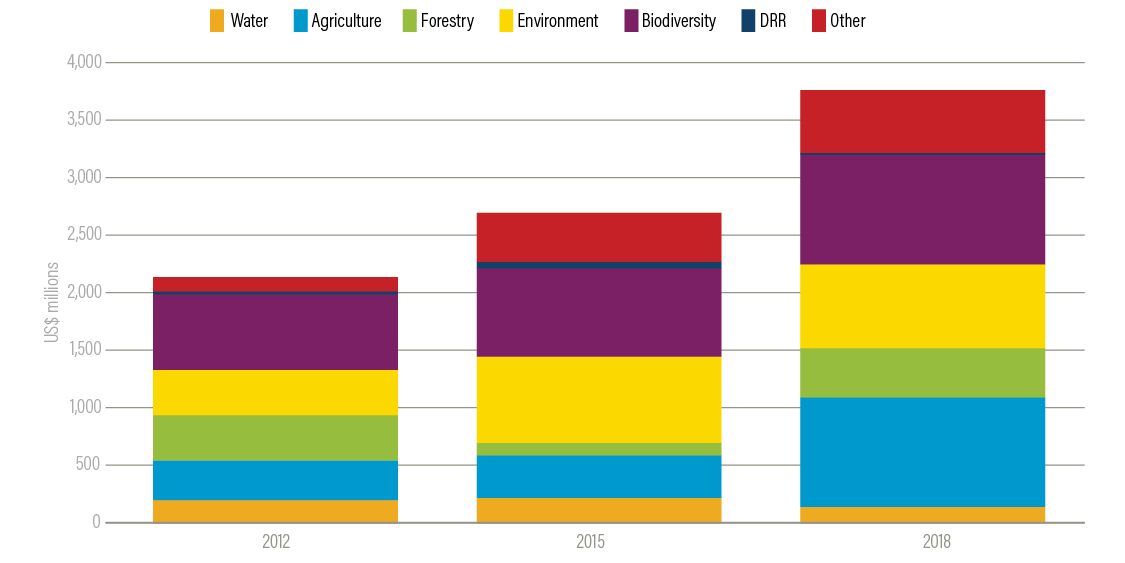
In 2018, the largest bilateral donors for NbSA included Germany, the United Kingdom, Japan, and Sweden. The European Union, Asian Development Bank, Green Climate Fund, and the International Fund for Agricultural Development were among the largest multilateral donors and channels of funding. Grants were, by far, the most common funding modality, accounting for as much as 85 percent of funds deployed to developing countries. Sub-Saharan Africa, South Asia, and Latin America and the Caribbean received the greatest volume of funding for NbSA. Although each country’s use of international support is different, agriculture, general environmental protection,6 and biodiversity are the most common sectors in which ODA funding directed toward NbSA was spent.
This paper also identifies barriers in the ODA funding landscape that, if addressed, can help donors maximize the impact of their public capital to accelerate these much-needed investments. These barriers also, directly and indirectly, contribute to the lack of pipeline and inhibit the development of NbSA projects. Key barriers include the following:
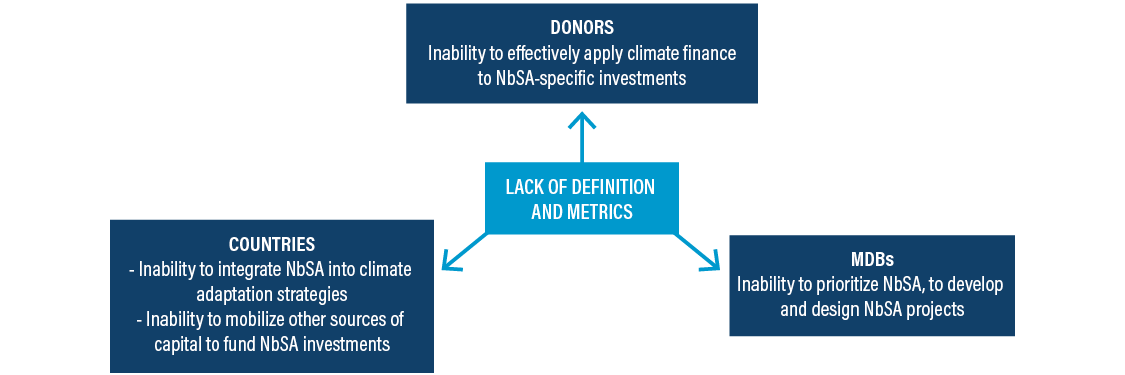
- No common definition of NbSA exists. Countries, as well as other key stakeholders, still lack clarity around what constitutes adaptation-focused NbS. This confusion is most evident in international tracking systems (e.g., the Organisation for Economic Co-operation and Development’s statistics database) and within countries, and it likely inhibits the potential pipeline of NbSA investments.
- No clear metrics exist to value NbSA. Interviewees for this paper noted the need for metrics and methodologies to measure NbSA benefits and stated that the lack of such makes it difficult for developing countries, project developers, development institutions, and investors to appraise and compare NbSA options against other investment options; thus, they often are not prioritized.
- Donor sources of funding do not align with needs. Donor funding sources, where available, are insufficient in volume to meet all NbSA needs (measured by the potential demand evidenced through a country’s NDC and national adaptation plan). Donor sources have primarily been in the form of grant capital. Many interviewees noted that NbSA projects need ongoing funding to support longer-term operational costs. This results in a significant funding gap that neither private investors nor developing countries can bear.
- Channels of donor funding do not explicitly promote NbSA. Climate finance channels do not provide clear, specific guidance on how their funding can be used to support NbSA investments.
- Challenges in developing the NbSA pipeline hinder access to financing. At both the national and subnational level, developing countries may lack the technical capacity to integrate NbSA into their adaptation planning and sufficiently develop NbSA projects and/or the NbSA project pipeline.
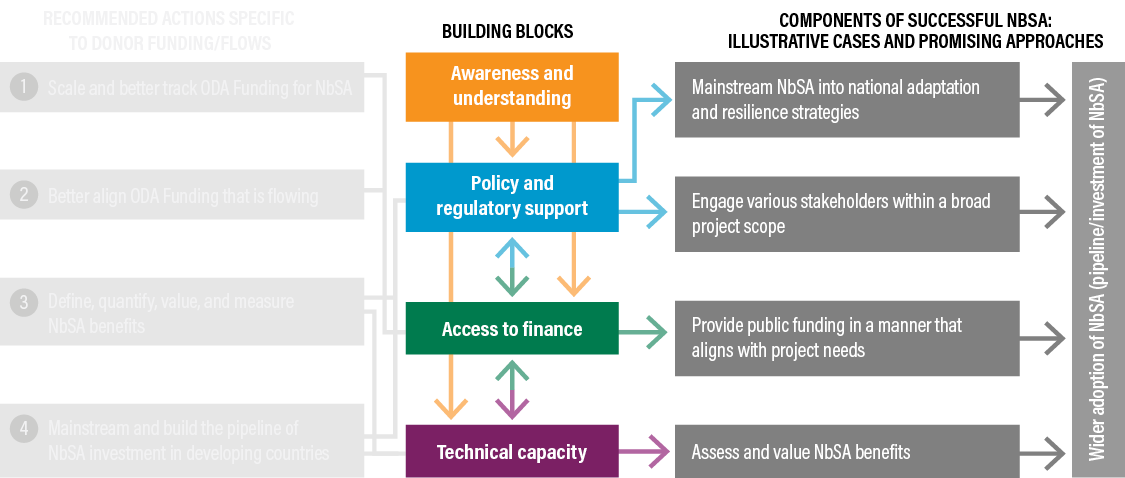
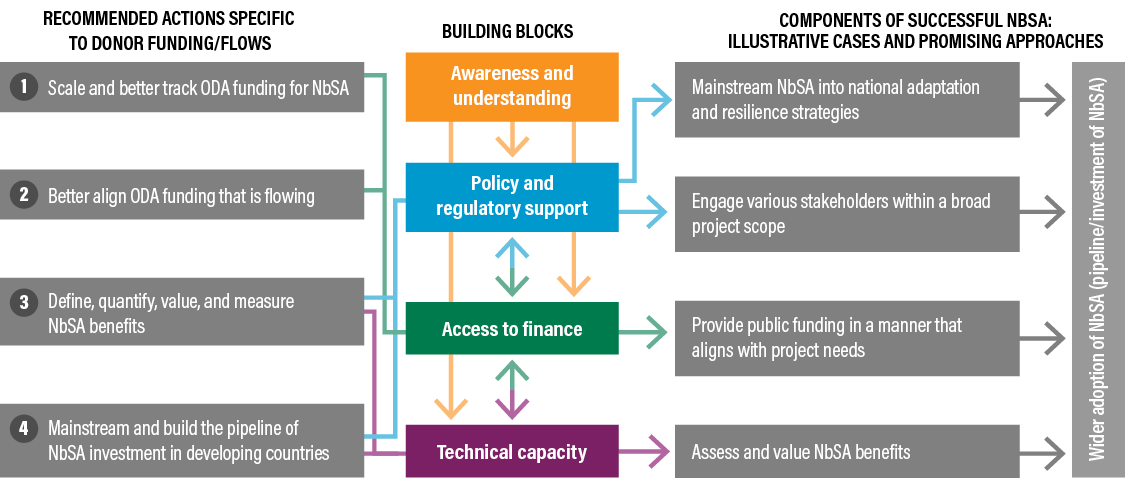
This paper puts forward four recommended actions to address these barriers hindering public donor funding support for NbSA. These recommended actions for public donors complement recommendations from reports that focus on mobilizing private capital for NbSA (see Box 4 in Section 5).
- Scale and better track ODA funding for NbSA. Donors should scale up the ODA allocated for NbSA, help to ensure accounting mechanisms better track flows, and provide the technical support to help developing countries develop and finance NbSA investments.
- Better align ODA funding that is flowing. Current ODA funding needs to be more closely aligned with individual NbSA project needs. Public funding is valuable to build capacity, prepare projects, and crowd in private capital. Donors should consider a more strategic application of public funding through flexible mechanisms, including concessional instruments to crowd in capital and grant support (where needed) over the life of the project where operational costs are unable to be borne by local governments or others.
- Define, quantify, value, and measure NbSA benefits. Donors should develop, adopt, and accelerate a common approach to quantify and value NbSA benefits in ways that are meaningful for investment decision-making by a variety of public and private investors.
- Mainstream and build the pipeline of NbSA investment in developing countries. Donor funding should support efforts by developing countries to both mainstream NbSA into national adaptation and development-related policies, budgets, and investment plans and build a pipeline of NbSA investments at the country level, through capacity building, project preparation, and technical assistance for developing countries.