
Globally, 1.24 million people are killed in traffic crashes every year. This number is expected to keep rising as vehicle fleets grow, to become the 5th largest cause of death by 2030. The majority of these deaths happen in and around urban areas, disproportionately affecting vulnerable road users such as pedestrians and bicyclists. The percentage of the world’s residents living in cities is also on the rise, from 50 percent in 2007 to 70 percent in 2030, making it vital for cities to address the need for safer streets. Traffic crashes also exact an economic toll. In some countries, such as India, the economic cost of traffic crashes equals 3 percent of the nation’s Gross Domestic Product.
To address this alarming issue, the United Nations has declared a Decade of Action to address the challenges of traffic safety across the world, including through safer urban mobility and street design. As global cities look to reduce the threat of traffic deaths and injuries, there is a need for evidence-based solutions proven to improve safety and make cities livable, efficient and productive. Yet knowledge and global best-practices for creating safer cities are not well-documented in any global guide.
Cities Safer by Design collects this information into one resource addressing issues such as enhancing urban design to increase walkability, reducing vehicle speeds that threaten all road users, providing high-quality spaces for pedestrians and bicyclists, and improving access to mass transport.
At WRI Ross Center for Sustainable Cities, we find that making urban travel safer is not only about health, but quality of life and creating sustainable, competitive, equitable and smart cities. Providing safe and convenient infrastructure opens up opportunities to all people. Walking and bicycling can thrive, helping curb emissions while offering active, healthy forms of transport. Mass transport can reach more people, helping cut vehicle emissions contributing to global warming and air pollution, while decreasing travel times. These solutions that benefit people also benefit the planet and economic development.
I encourage planners and policymakers to use this guide, and implement change in how they design and plan cities and streets. At WRI Ross Center for Sustainable Cities, our approach is to “Count it, Change it, Scale it.” Cities can use the practices outlined in this guide to deliver change on the ground, informed by local context, and scale these solutions to improve traffic safety and quality of life.
Cities that are safer by design help create an urban world where everyone can thrive. Cities safer by design can save lives.

President
World Resources Institute
Many of the world’s cities can become safer, healthier places by changing the design of their streets and communities. Where public streets have been designed to serve primarily or even exclusively private motor vehicle traffic, they can be made immensely safer for all users if they are designed to effectively serve pedestrians, public transport users, bicyclists, and other public activity.
This is currently not the case in many cities. Traffic fatalities account for 1.24 million annual deaths, with over 90 percent of global traffic deaths occurring in low- and middle-income countries (WHO 2013). Currently estimated to be the eighth leading cause of death worldwide, this is expected to become the fifth leading cause of death by 2030 at current trends. The majority of these fatalities are vulnerable road users—pedestrians and bicyclists in developing countries who are usually hit by motorized vehicles (WHO 2009).
These deaths can account for hefty tolls on economic development, with traffic deaths amounting to 3 percent of gross domestic product (GDP) in India and Indonesia, 1.7 percent in Mexico, 1.2 percent in Brazil, and 1.1 percent in Turkey (WHO 2013). Almost half of all traffic fatalities occur in cities; a larger proportion of serious road traffic injuries occur in urban areas and involve vulnerable road users (Dimitriou and Gakenheimer 2012; European Commission 2013).
This global health issue is being pushed by large underlying forces. Across the world—especially in places such as Brazil, China, India, Mexico, Turkey, and other emerging economies—people are buying private cars or motorcycles at a galloping pace. The world’s car population has already passed 1 billion and is expected to reach 2.5 billion by 2050 (Sousanis 2014). The percentage of the world’s residents living in cities will increase from 50 percent in 2007 to 70 percent in 2030 (UNICEF 2012). Urban land areas are expected to double by 2020 from 2000 levels (Angel 2012). Between considerable population and economic growth, there is enormous demand for new housing and urban expansion, with streets and the public space network linking everything together.
A common response to all of these issues is to build roads and design communities for automobiles. Yet this is just a short-term solution to ease traffic or improve safety only for drivers, and in time will only stimulate more growth in car use, a need for even more roads, and more overall traffic fatalities (Leather et al. 2011).
There is another path. Cities can design streets and the built environment to be safer, not only in new communities, but also by transforming existing neighborhoods and streets. Considering a comprehensive street network and the hierarchy of its users can reveal opportunities not only around critical transit corridors, but in the surrounding neighborhood streets. This is called a “safe system” approach to traffic safety. It sets targets and works to change the road environment to reduce injuries and fatalities (Bliss and Breen 2009).
Through its EMBARQ sustainable urban mobility initiative, WRI Ross Center for Sustainable Cities has created this guide to provide real-world examples and evidence-based techniques to improve safety through neighborhood and street design that emphasizes pedestrians, bicycling, and mass transport, and reduces speeds and unnecessary use of vehicles.
The guide provides an overview in chapter 2 on the current conditions for traffic safety in cities, the different groups of people impacted by safety, and what it means to make cities “Safer by Design” through urban and street design that improves safety for all road users.
The rest of the guide—chapters 3 to 8—provides descriptions of the different measures and elements that make up the key design principles to promote safety. These principles are composed of the following themes, and can be found in positive examples from cities across the world.

Beijing, China
Urban design that reduces the need for vehicle travel and fosters safer vehicle speeds
Develop mixed land uses, smaller blocks, ground-floor activities, and nearby public facilities that reduce overall exposure to traffic crashes from less vehicle travel.
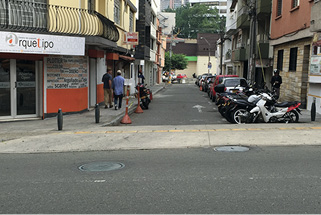
Medellín, Colombia
Traffic calming measures that reduce vehicle speeds or allow safer crossings
Integrate proven measures such as speed humps, chicanes, chokers, refuge islands, traffic circles, shared streets, and other street design applications that can reinforce safety.
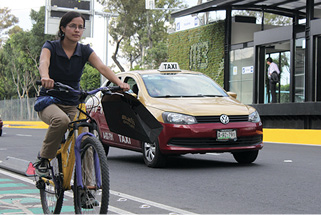
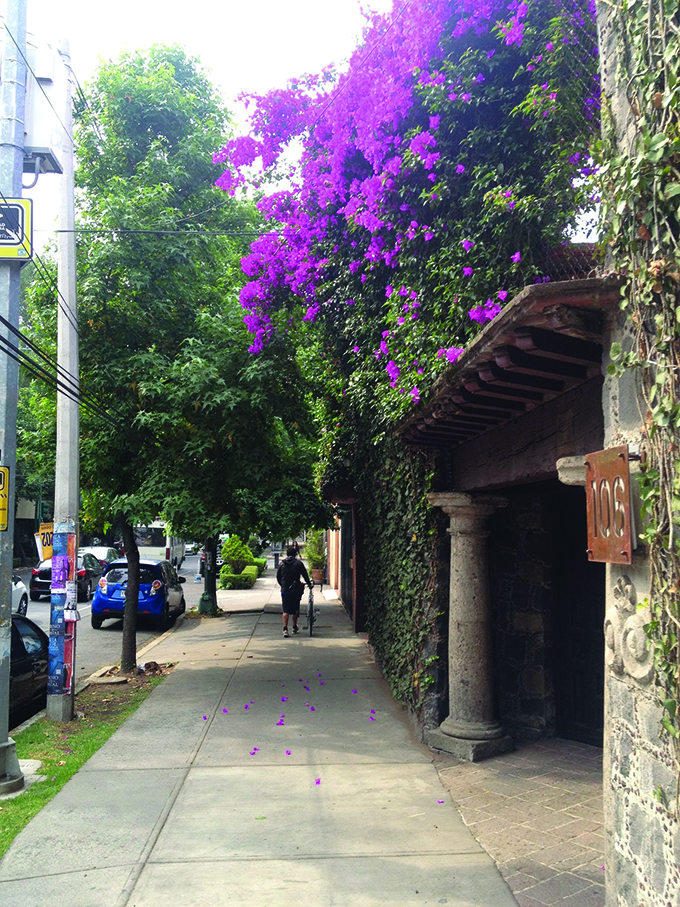
Mexico City, Mexico
Arterial corridors that ensure safer conditions for all road users
Improve arterials and other main streets to ensure the safety of pedestrians, cyclists, mass transit as well as motor vehicle drivers through reduced crossing distances, lead pedestrian intervals, refuge islands and medians, safe turning movements, and lane alignments. Consistent designs should create a forgiving road environment with the least surprises for the road user, especially for vulnerable users.
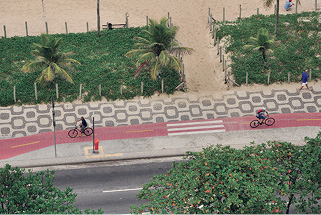
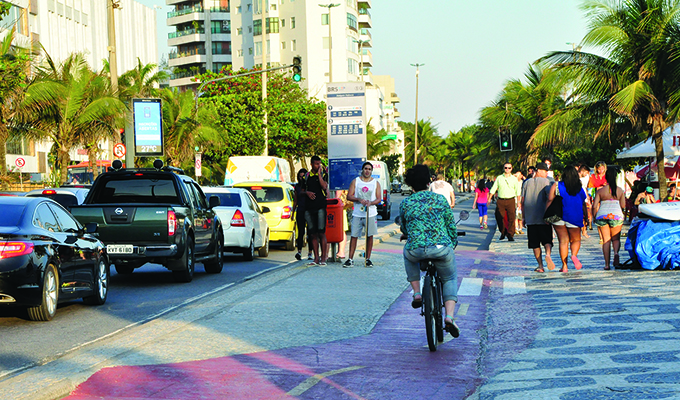
Rio de Janeiro, Brazil
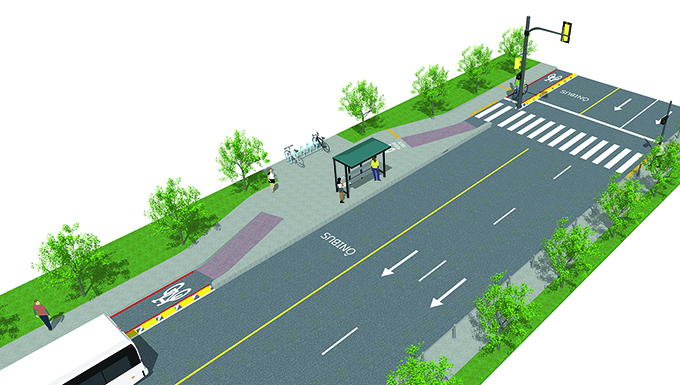
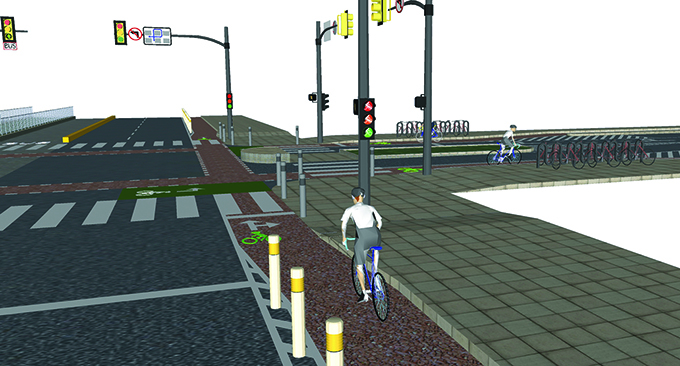
A network of connected and specially designed bicycling infrastructure
Design accessible, bicycle-friendly streets that include protected bike lanes or cycle tracks and connected networks. Pay special attention to reducing conflicts at junctions between cyclists and turning vehicles.
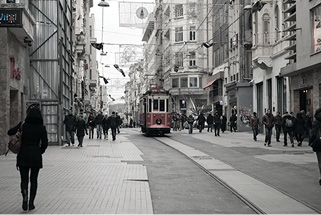
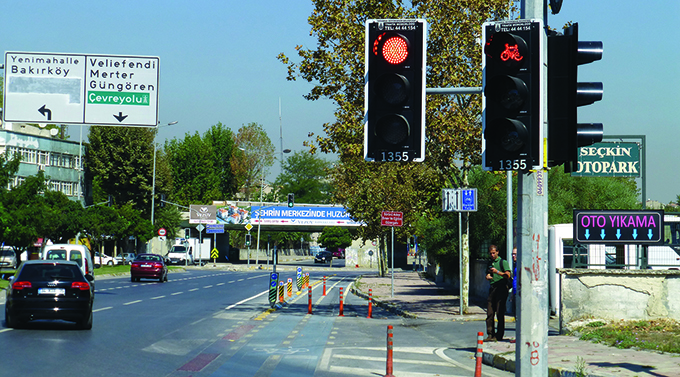
Istanbul, Turkey
Safe pedestrian facilities and access to public spaces
Provide quality space for pedestrians through sidewalks and street space, as well as access to parks, plazas, schools, and other key public spaces. Design these spaces to be attractive for pedestrians.
Ahmedabad, India
Safe access to mass transport corridors, stations, and stops
improve access to transit, in part by avoiding physical barriers. Create a safe and secure interchange environment.
Version 1.0 allows for a “road test” to work with designers, auditors, project managers, policy makers, and other stakeholders involved in the way streets and communities are designed. During this road-test period, we will learn how the guide can be applied in cities and complete a review to improve it further.
This road test will include workshops, use in road safety audits and inspections, black spot (also known as hot spots, or high crash locations) treatment, and application to on-the-ground projects in coordination with city planners and officials. This process will occur across several countries and cities. It will seek out more examples that can explain real-world application of evidence-based measures, as well as additional evidence from different areas of the world to enhance the global understanding of safer design. Those interested in providing feedback, examples of good practices, and evidence can contact the project team through our email address: saferbydesign@wri.org.
Cities Safer by Design provides an overview of how cities around the world can design communities and streets in a way that maximizes safety and health while promoting a more sustainable form of urban development. The guide can be used by designers, private and public developers, engineers, public health experts, city planners, policy makers, and others working to create plans and implement projects that include street and community design.
The guide can aid road safety audits and inspections. Planners and policy makers also can use it to inform how and what policies and projects ought to be created to enhance safety and improve quality of life, including urban mobility plans, transit-oriented development, city plans and regulations, and citywide pedestrian safety action plans.
The guide acts as a general direction on how to create the solutions that have been proven to be effective in creating a safe urban environment. However, cities and countries can be very different in their history, culture, design, development, policies, processes, and a variety of other factors. The guide focuses on the practices and characteristics of city planning and design that can be applied in a variety of situations, but local solutions and discretion should be taken into account, adapted and adjusted, measured and replicated. The current Version 1.0 of the guide will be further informed by a road-test process and subsequent version based on this process.
In this guide, we provide a number of measures and terms in each chapter. The definitions for these measures are provided in each summary of the item. A few terms appear throughout the document, including:
Crash frequency models. Crash frequency models also are referred to as safety performance models or accident prediction models. These models consist of statistical analysis that aims to predict the safety performance of an entity (e.g. street, intersection, neighborhood), using variables that account for exposure (traffic volumes, pedestrian volumes) and risk factors (intersection geometry, signal control, block sizes etc.). These models often use a Poisson or negative binomial distribution.
Exposure. In the context of road safety, exposure is defined as the state of being exposed to risk. The measure of exposure aims to indicate the likelihood that certain segments of the population could be involved in crashes. It is based on the amount of time, volume, or distance. In the context of crash models, exposure may include total motorized traffic volumes (vehicle kilometers traveled, or VKT; annual average daily traffic, or AADT), or travel volume of pedestrians and cyclists.
Lead pedestrian interval. A signal configuration under which pedestrians get the green light several seconds before traffic going in the same direction. This can help avoid conflicts between pedestrians and right-turning traffic, by making pedestrians more visible.
Risk. In terms of traffic safety, risk can have different meanings. It can be a situation involving exposure to danger, injury, or loss that may involve several factors such as perception, propensity, and reward (e.g. crossing the street faster at midblock). It can also refer to an injury rate that takes the number of injuries or crashes over the amount of exposure, or over the population. Lastly, risk can refer to perception of risk or the propensity to take risk.
Road safety audit (RSA). RSA is a qualitative evaluation of safety conditions for a roadway or transport project that is currently in the design phase, carried out by an experienced road safety auditor. Unlike an RSI, an RSA evaluates the design drawings, not just the infrastructure.
Road safety inspection (RSI). RSI is a qualitative evaluation of safety conditions along an existing roadway, carried out by an experienced road safety auditor. A road safety inspection can help identify issues not evident in the study area crash data, based on the auditor’s expertise, best practices, and more systemic studies.
Traffic calming. The combination of street designs and traffic rules that deliberately reduces vehicle speeds by designing and building interventions (e.g. speed humps, raised crossings, chicanes) to improve safety for all road users, especially pedestrians and cyclists.
Transit-oriented development (TOD). A type of community development that includes a mixture of residential, commercial, office, and public facilities to maximize use of public transport. It often incorporates design features to encourage walking and cycling. A TOD neighborhood typically has a center with a transit station or stop, which is surrounded by relatively high-density developments that are generally within a radius of 400 to 800 meters, or one-quarter to one-half mile.
Vulnerable road users. A collective term for a group of road users who have a high injury or casualty rate, mainly pedestrians, bicyclists, and motorcyclists. Vulnerability is defined in a number of ways, such as by the amount of protection in traffic or by the amount of task capacity (e.g. the young and the elderly).
Traffic safety has much to do with the interaction among people, the street environment, and vehicles, and creating quality of life in cities.
Sustainable urban development or transit-oriented development is defined here as the urban-built environment that involves compact, mixed land uses, access to high-quality mass transport, and streets that reduce traffic speeds and limit vehicle presence in key areas. This provides opportunities for walking and bicycling rather than driving to school, the park, the store, work, the doctor, family and friends, and other daily activities. As the New Climate Economy explains, these places are connected, compact, and coordinated (NCE 2014).
Promoting sustainable urban development can have a strong and positive relationship with traffic safety. This comes from two key safety issues: exposure and risk. Sustainable urban development practices can (a) reduce exposure by preventing the need for vehicle travel, thus preventing a crash before a trip would even begin; and (b) diminish risk by encouraging safer vehicle speeds and prioritizing pedestrian and bicyclist safety.
Taking full advantage of these potential safety benefits requires close coordination of transport and land use planning, and implementation, as well as ongoing data analysis, assessment, and performance measurement.
This chapter describes what it means to have cities that are safer by design, and includes the following:
How many traffic fatalities are occurring in the world’s major cities? While the World Health Organization (WHO) provides country-level statistics and information on how policies and practices are being addressed in its Global Status Report on Road Safety, data at the city level has not been collectively presented on a global scale. Providing better information on how cities compare across the world can help inform where and how different cities can approach improving traffic safety and the data used to do so.
EMBARQ collected data on reported traffic fatalities in cities worldwide. The data come almost entirely from government sources, at either the national or city level (Welle and Li 2015). As with country-level figures, there may be significant variation in terms of underreporting, follow-up with hospitals, data reliability, and other issues. Some cities and countries may not have developed a system based on international standards and local context to provide an accurate number of traffic fatalities. This is why some cities with better data collection and reporting may show higher numbers of fatalities than others.
Data from higher income countries are generally more reliable, so many of the cities outside the more developed regions may have much higher fatality rates than reported. For example, WHO estimates that on the country level Ethiopia may have nearly six times more traffic deaths than reported, and in India the estimate is nearly two times the reported deaths (WHO 2013). Li et al. (2006) estimated that the fatality rate in Shanghai in 2003 was 14.18 per 100,000 inhabitants. Others, such as those in Brazil, may appear at the top of the chart because of better crash reporting systems, though they still have very high fatality rates.
Improved crash data practices by cities are clearly needed, as is deeper research on injuries. A WHO publication—entitled Data Systems: a road safety manual for decision-makers and practitioners (2010)—provides more information on improving such systems. It is also difficult to compare cities when data quality and reporting is uneven, and there is no generally accepted methodology developed to benchmark differences in safety levels between cities and overcome differences in size, function, and morphology (Jost et al. 2009). An expanded effort to analyze the status of traffic safety in the urban context would allow cities to compare themselves more along these multiple factors and analyze their own systems.
Figure 1.1 | Reported Traffic Fatalities Per 100,000 Inhabitants in Selected World Cities
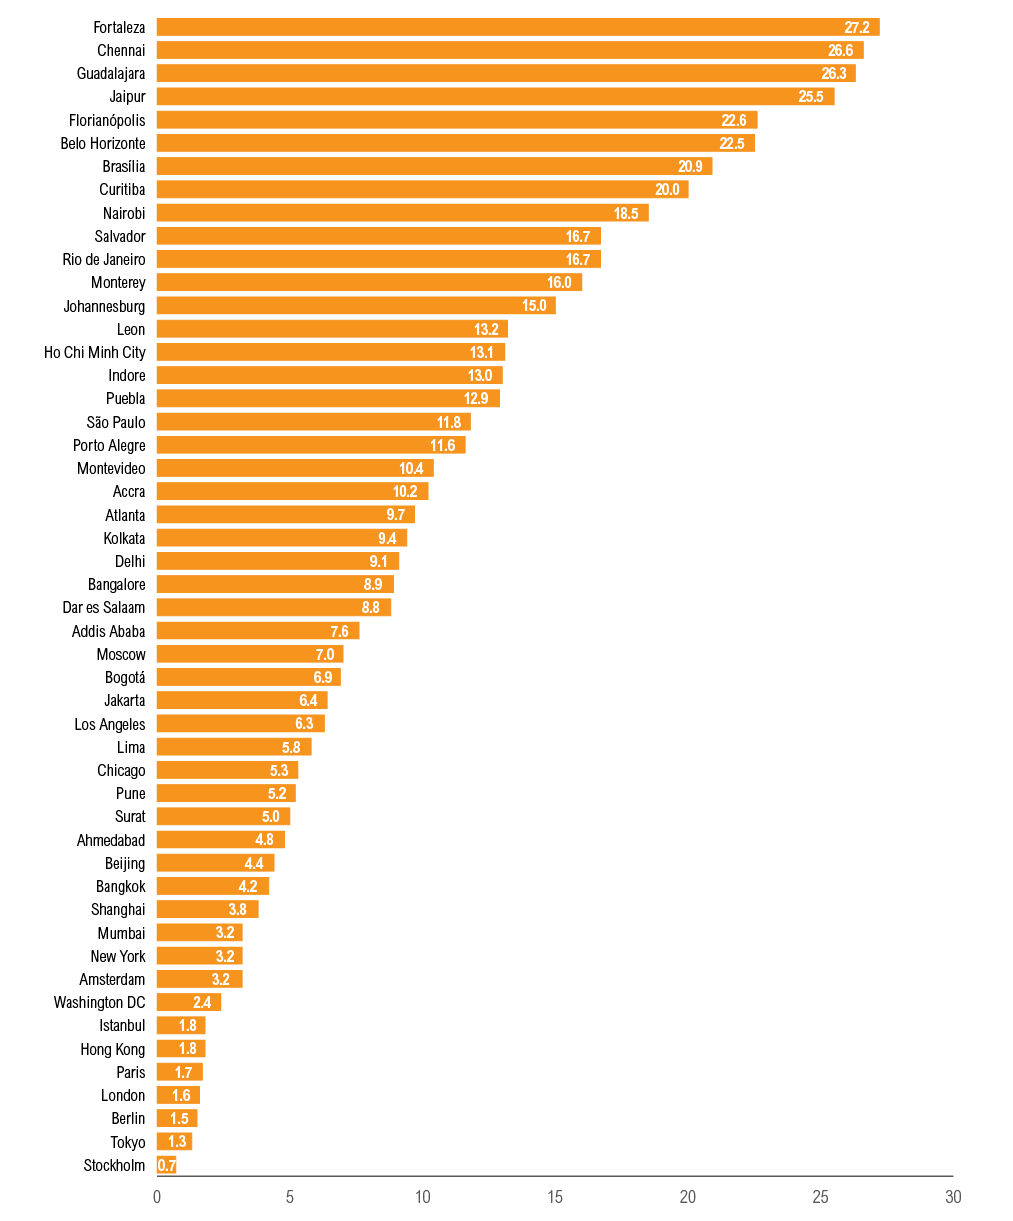
Source: EMBARQ technical note (Welle and Li 2015).
Note: Actual fatalities may vary for some cities with poor crash reporting systems.
The level of safety is partly contingent on the way people use the city and embark on their daily activities. Many different types of people are impacted by traffic safety. While there are numerous groups of people affected by traffic safety, some key groups to consider include the following:
Children. Road crashes are the leading cause of death among young people ages 15–29, and the second leading cause of death worldwide among young people ages 5–14 (WHO 2003). In Brazil from 2008–12, for instance, 4,056 children died in traffic crashes. Can children safely walk or bicycle to school, parks, and playgrounds? Can they bicycle on city streets?
The poor. People from lower socioeconomic backgrounds are more likely to be involved in traffic crashes, and often live in areas with low-quality infrastructure (WHO 2003). Are streets designed to protect and help those with lower socioeconomic status achieve access to upward mobility without a disproportionate threat of serious injury or death?
Elderly and the disabled. Older pedestrians and cyclists can account for up to 45 percent of pedestrian fatalities and up to 70 percent of cyclist fatalities (Oxley et al. 2004). Is there safe mobility for the elderly and disabled? Are the elderly accounted for in street design standards and processes?
Men and women. When analyzing safety by gender, there can be different levels of real or perceived safety. Traffic deaths are the leading cause of death globally for young men, and women and men have been shown to perceive traffic safety differently (DeJoy 1992).
Commuters and workers. Most workers spend anywhere from 30 to 60 minutes or more traveling to and from work—a time when they are at risk for falling victim to traffic crashes while trying to earn a living. Can commuters expect a safe trip to and from their work?
Customers. Research has shown that pedestrian and other crashes are associated with the location of retail land uses, at the places where people are going to buy clothes, food, and other consumer goods (Wedagamaa, Bird, and Metcalfe 2006). Can shoppers and errand-runners complete their activities in a safe place, and can they reach shopping areas safely?
Citizens. Those living in dense urban centers need space for civic activities and cultural enrichment, but they can encounter poor traffic safety conditions trying to access parks, plazas, libraries, and special events. Is the city a safe space for recreation and interaction, events and leisure?
Visitors. Road crashes are the single greatest annual cause of death of healthy U.S. citizens traveling abroad. This is likely the case for tourists from all countries (Association for Safe International Road Travel (ASIRT)( n.d.). Can tourists and traveling businesspeople safely arrive and find their way to sites and meetings?
Looking closer within cities reveals that safety and design go hand in hand. The safest cities in the world for traffic safety include Stockholm, Berlin, Hong Kong, and Tokyo (see figure 1.1). These cities and others with lower levels of traffic crashes and deaths share certain characteristics.
Safer cities tend to be ones with extensive mass transport, good conditions for walking and cycling, and fewer cars on the road driving short distances at safer speeds, which lower the energy levels inflicted from vehicle impact. Data confirms there are fewer fatalities in places with fewer vehicle miles traveled and those promoting mass transport, walking and cycling, thus reducing overall exposure (Duduta, Adriazola, and Hidalgo 2012). These cities also have comprehensive traffic safety plans, which at their core pay attention to reducing vehicle speeds to make them safe for walking and cycling, in addition to providing good infrastructure for these modes. The approach is called safe systems (Bliss and Breen 2009).
This guide provides design principles to help achieve this safer environment. It can be explained under the following interconnected categories found in research on urban and street design.
When rebuilding a road to promote safer conditions, the introduction of Bus Rapid Transit has been shown to reduce traffic crashes on urban roads, in addition to providing a safer in-vehicle experience than motor vehicle drivers (Duduta, Adriazola, and Hidalgo 2012). Global research shows that cities with higher shares of mass transport use have fewer traffic fatalities (Litman 2014).
Taken together, these key considerations can reduce the need for vehicle travel exposure to traffic while lessening the risk of injury for everyone, especially pedestrians and cyclists.
Policies are beginning to embody this framework for a safer city. Mexico City’s Mobility Law and policies recommended by the European Traffic Safety Council are providing a hierarchy of modal priority that begins with pedestrians, followed by cyclists, mass transport, and lastly, automobiles, to address concerns such as safety and sustainability ahead of moving only motorized traffic (ETSC 2014). The cities with the best road safety records in the world incorporate sound design of their streets for pedestrians, cyclists, and mass transport to further reduce exposure and risk. Gothenburg, Sweden, for example, has introduced extensive traffic calming and car restriction measures, and significantly reduced the number of traffic fatalities over the past twenty-five years (Huzevka 2005).
This is especially important given the large numbers of pedestrians and bicyclists on the road. In most Latin American cities, walking comprises around 30 percent of all trips (Hidalgo and Huizenga 2013). Asian cities have historically high rates of walking, biking, or mass transit. Unfortunately, the unsafe conditions for walking and cycling may be pushing people toward car use.
Cities nevertheless have an opportunity to create places that are safe for all residents and reverse the trend of growing traffic fatalities.
Data can dramatically help cities create a safer system and deploy the design principles presented in this guide. Cities with traffic crash data collection systems in place can review and analyze the information for a variety of uses, including creating policy goals, identifying the most dangerous streets and locations (known as black or hot spots), and learning how streets can be designed safely.
Cities can establish a process to inspect high-risk areas and make appropriate changes to improve safety. New York City, for example, analyzed pedestrian crashes citywide and targeted street design changes toward high-risk corridors (NYC DOT 2010). In Turkey, EMBARQ Turkey has helped five municipalities identify black spots and recommend traffic calming and other design changes based on road safety inspections.
Data can be used to provide evidence about what makes a city safer, including before and after measurements of road design changes and crash frequency models comparing different street designs within a city.
Hand in hand with data analysis, improving traffic safety in cities relies on successfully measuring the performance of various interventions. According to the World Bank, periodic monitoring and evaluation of traffic safety targets and programs are essential to assess performance and are integral to a safe system approach to traffic safety (World Bank 2013).
There are a variety of factors to consider in evaluating the progress of traffic safety policies and projects. Decision makers, engineers, and planners instituting traffic safety plans and measures within community and street design can consider the following key indicators in monitoring and evaluation.
Final safety outcomes. These include deaths and injuries recorded by police, hospitals, health authorities, or other sources of such information. A common indicator is the number of traffic fatalities per 100,000 inhabitants, which is ideal for comparing jurisdictions or for monitoring progress over time. A common form of measurement counts those killed or seriously injured, abbreviated as KSI.
Exposure. Kilometers traveled by mode, traffic volume by mode, mode share of trips or commuting trips.
Risk. Traffic crashes, fatalities, and injuries over mode or passenger distance traveled. Traditional engineering has often focused on reducing crash frequency per VKT, which can lead to a bias toward treatments that improve car occupant safety. Instead, cities can treat all the modes fairly and focus on locations that are especially prone to produce fatalities or serious injuries.
Infrastructure and Design. Includes the number of safety engineering treatments per section of street network, characteristics of community design that reduce speed or offer good conditions for walking, cycling and mass transport facilities and volume, and average vehicle speeds by road type.
Perceptions. Perceived safety of bicycling and walking, percent of residents who feel safe crossing the street, percent of residents satisfied with pedestrian, cycling, and public transport facilities.
Figure 1.2 | The Relationship Between Pedestrian Safety and the Impact Speed of Vehicles

Note: The above figure shows the relationship between pedestrian fatalities and vehicle impact speed published by the OECD (2006). Some recent studies show a similar relationship, but account for sample bias to find slightly lower risks in the 40 to 50 km/hr range. (Rosen & Sander 2009, Tefft 2011, Richards 2010, Hannawald and Kauer 2004) There are not, however, studies from low- and middle-income countries where things like vehicle type, emergency response time and other characteristics may influence this relationship. In any case, there is clear evidence to support policies and practices that lower vehicle speeds to 30 km/hr where pedestrians are commonly present, and no more than 50 km/hr on non-grade separated streets.
Changing the current paradigm involves a process by which cities can limit vehicle travel while maximizing safety for those who are traveling. A framework for this approach is the Avoid-Shift-Improve paradigm (Dalkmann and Brannigan 2007). The framework was created as a way to reduce carbon emissions from transport, but it can also be adapted to traffic safety. Cities can find synergies in policies to address both climate change and traffic safety. In terms of traffic safety, this means avoiding unnecessary vehicle trips, shifting trips to safer, less threatening modes, and improving the existing environment and operations to be safer for all road users.
Avoid unnecessary trips to prevent traffic fatalities and injuries, by creating an urban development pattern that is compact, walkable, and accessible by mass transport and contains mixed land uses.
Shift trips to safe or less threatening modes from automobile travel by creating high quality transit and compact development, allowing people to safely walk and bike.
Improve the design and operation of urban development to maximize safety of all trips, by slowing speeds and protecting pedestrians and bicyclists.
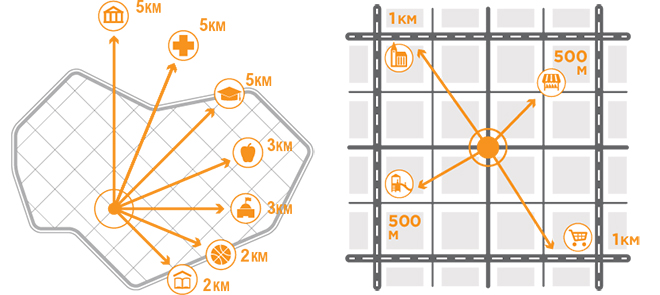
An urban form framework that reduces driving and encourages walking and biking is described as the “5Ds” of density, diversity, design, destination, and distance (Ewing and Cervero 2010). Density refers to the number of housing units or quantity of office space per hectare, or built density. Diversity is a measure of land use mix, based on the hypothesis that people are more likely to walk in areas with a mix of shops, offices and housing, rather than in single use suburban neighborhoods. The third dimension, design, refers to the quality of the pedestrian environment, number of street trees, presence of street furniture, etc. Destination refers to the ability or convenience of accessing different trip destinations from a point of origin, such as to major commercial and employment centers. The last factor, distance, refers to the proximity of public transport to reach destinations. This definitive study found that people tend to walk and use transit more and drive less in areas with better pedestrian facilities, such as wider sidewalks, more transit stops, and a good combination of the characteristics that define the 5Ds.
EMBARQ Mexico has developed guidelines to promote the 5Ds and transit-oriented development in a manual for the Mexican context that can be applied in other developing countries. The manual identifies the following key elements in shaping overall development: (1) quality, safe facilities for non-motorized transport; (2) high-quality public transport; (3) active and safe public spaces; (4) mixed land uses; (5) active street life; (6) management of automobiles and parking; and (7) community participation and security.
Figure 1.3 |Traffic Crash Locations Can Be Analyzed Using “Heat Maps”
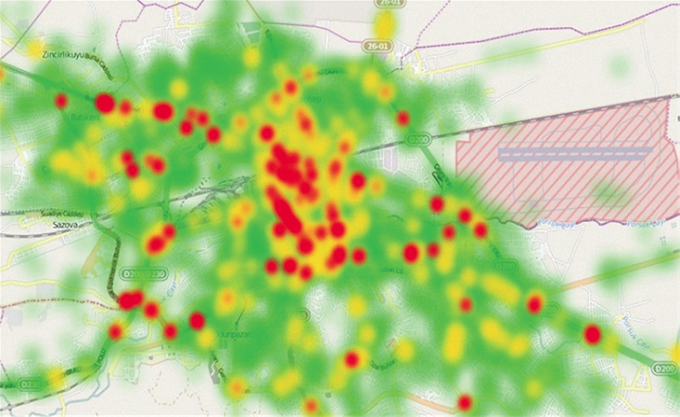
The heat maps shown here from Turkey use PTV Visum Safety software to identify street corridors or neighborhoods for design, enforcement, or other targeted actions to improve safety. These maps can address pedestrian or bicycle crashes, areas around schools, and other more specific topics.
Every other year the city of Copenhagen undertakes an account of bicycling in the city, measuring a range of factors from the number of bicyclists to residents’ opinions about whether they would ride if they could feel safer. A key feature of the account is that it makes a distinction between actual safety and the sense of safety in traffic. The city notes that “actual safety refers to the number of serious casualties involving cyclists in Copenhagen. Sense of safety refers to the individual’s subjective perception of how safe it feels to cycle” (City of Copenhagen 2010). The city’s account notes that both factors are crucial in its effort to become the world’s best city for bicycling, and it uses these and other key indicators to continuously monitor and evaluate the performance of bicycling in the city. Cities such as Minneapolis and more recently Bogotá have introduced bicycle accounts to evaluate and measure progress toward their goals. Similar accounts can be used for monitoring pedestrian activity and safety, in addition to evaluations of street redesign, seen in New York City’s “Measuring the Street” report.
Building safer cities for pedestrians and cyclists doesn’t only mean improving streets. Urban design plays an important role in creating a safer travel environment. Cities can facilitate development that allows more people to use mass transit, walking, and bicycling and limit unnecessary motor vehicle trips.
Safer urban design can help reduce motor vehicle speeds and provide a safer and more user-friendly street network for pedestrians. The faster a driver goes, the more difficult it is for her or him to avoid hitting a pedestrian in their path. This is the case with large blocks, which encourage faster speeds, due to uninterrupted travel that allows vehicles to accelerate more freely while requiring more time to stop. Shorter block faces and narrower street widths can reduce speeds, provide more walkable conditions, and greatly reduce the chances of pedestrian death and injury. Some research shows that certain small block patterns with more four-way junctions may actually lead to more traffic crashes, but in this case the smaller street configurations still lead to fewer fatalities and injuries (Dumbaugh and Rae 2009).
Street network connectivity, which measures the directness of pedestrian and/or vehicle routes, is a key element in community design. Pedestrians and cyclists can find more direct routes in a more connected street network or grid as opposed to disconnected, cul-de-sac, or superblock networks that can discourage walking and bicycling.
Cities can foster the development of safer conditions for all road users through planning that prioritizes mass transport, pedestrians, and bicyclists.
Comprehensive or long-range plans. Cities can embrace the principles identified in this chapter within their major plans and zoning regulations, including clear and predictable standards and expectations for safety of a high quality public realm and a hierarchy that prioritizes pedestrians, bicyclists, and mass transport.
Local area plans. Cities can prepare local area plans that may provide guidance on community and street design for particular neighborhoods, such as transit station areas, development corridors, or other new or existing areas for urban development.
Transport and mobility plans. Citywide transport or mobility plans can take into account the needs of all road users by planning and setting goals, such as safety for vehicles, bicycle and pedestrian networks, and mass transit services (APA 2006). They can also set targets for desired modal splits. Several cities have created their own specific bicycle or pedestrian plans. These plans can set a hierarchy of road users and map existing and future cycling and pedestrian networks—through areas such as neighborhood streets and arterials, parks, off-street trails on rail corridors or waterfronts, boulevards, shared streets, pedestrian-only streets, and other public spaces that can be linked together in a connected web for direct and safe travel.
Strategic traffic safety plan. Cities can create specific plans to address traffic safety through a comprehensive approach that addresses a shared ownership between road users and designers to create a safer system. The plans can include ambitious targets to reduce traffic fatalities and serious injuries. For example, Copenhagen has its own Traffic Safety Plan for the city, and New York City recently released its Vision Zero Action Plan.
Street design guides. Many cities create their own pedestrian and cycling master plans accompanied by a tailored set of street design guidelines for the local context. This guide provides a general overview of the different tools cities can use to create a safer city by design, and can consider creating their own specific design guide for their problems, needs, opportunities, and strengths. Examples include the Abu Dhabi Urban Street Design Manual or the New York City Street Design Guide, which provides detailed information on everything from basic sidewalk designs to traffic calming measures to bicycling lanes and street fixtures.
This chapter describes specific key elements of urban form that, especially when taken together, can lead to increased safety:
Longer block faces allow higher vehicle speeds, placing pedestrians at higher risk.
Longer street blocks are unsafe for pedestrians. Long blocks commonly have crosswalks only at intersections, indirectly encouraging unsafe midblock crossings. Long blocks also encourage higher vehicle speeds due to fewer junctions that interrupt travel. More junctions mean more places where cars must stop and pedestrians can cross.
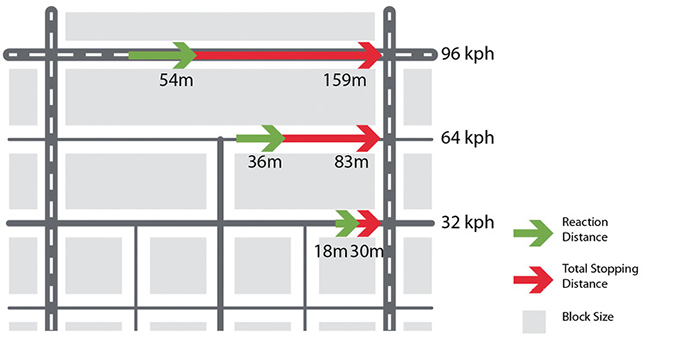
Note: Assumes 2 seconds reaction time and vehicle deceleration rate of 3.4 m/sa.
Figure 2.1 | Block Size Case
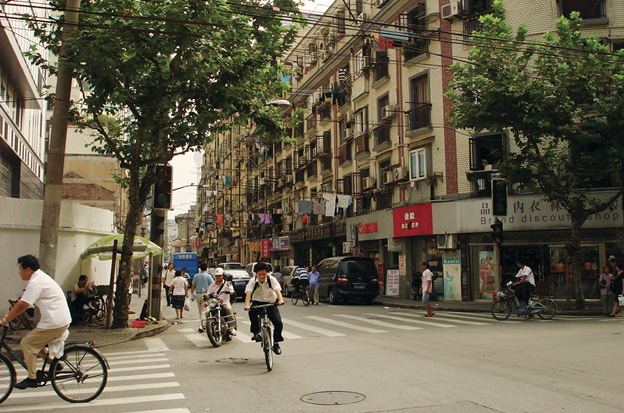
The smaller block sizes in the central areas of Shanghai foster a more walkable street network, as opposed to large superblocks that allow higher vehicle speeds and result in more dangerous mid-block crossings by pedestrians.
Connectivity refers to the directness of links and the density of connections in a street network. A highly connected network has many short links, numerous intersections, and minimal dead-ends. As connectivity increases, travel distances decrease and route options increase, allowing more direct travel between destinations and creating more accessibility (Victoria Transport Policy Institute 2012). It affects the need to travel and the attractiveness of walking and cycling.
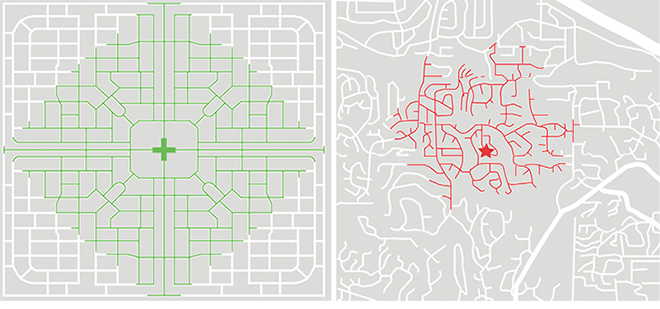
Comparison in 800-meter radius walking catchment in different street connectivity scenarios (compact grid vs. sprawling suburb).
Figure 2.2 | Connectivity Case
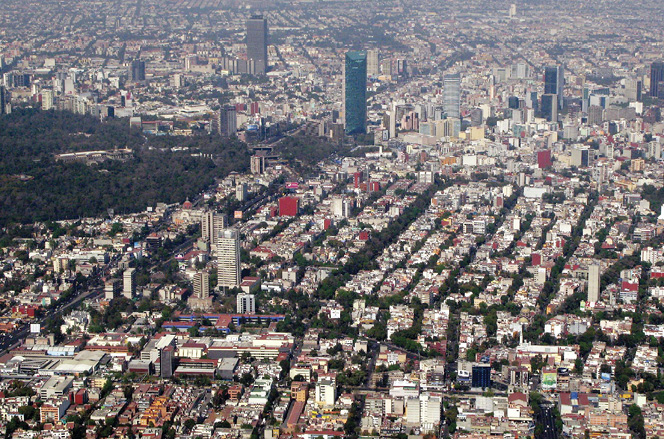
Many Mexico City neighborhoods have a connected street network, which makes walking more direct and convenient.
Street width often means the roadbed width, which is the distance between curb edges on opposite sides of a street, or, where no curbs exist, from pavement edge to pavement edge. The width of space allowed for vehicle travel on streets greatly influences pedestrian crossing distance and the roadway width potentially available for other uses, such as bike lanes, parking lanes, or landscape curb extensions. This is separate from the width of the space between buildings or the total public right of way, including sidewalks and other areas not dedicated to vehicles.
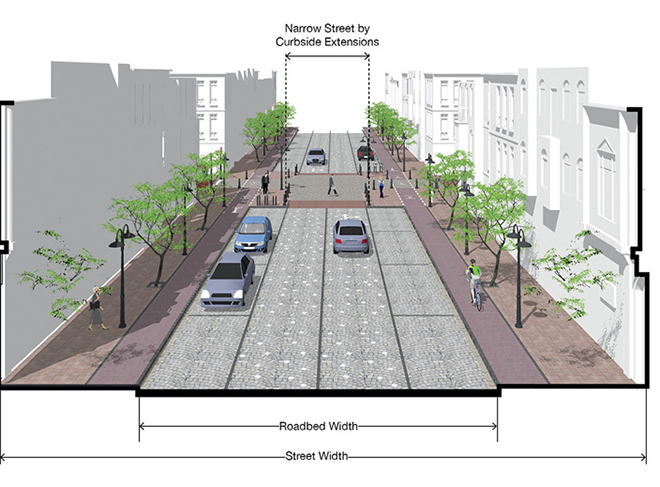
Illustration showing the different aspects of street width.
Pedestrian destinations or points of interest are normally places that people find useful or interesting or where employment, retail, and leisure uses concentrate. High-quality networks should be provided particularly between key destinations such as residential areas, schools, shopping areas, bus stops, stations, and places of work.
Destinations and points of interest.
Figure 2.4 | Access to Destinations Case
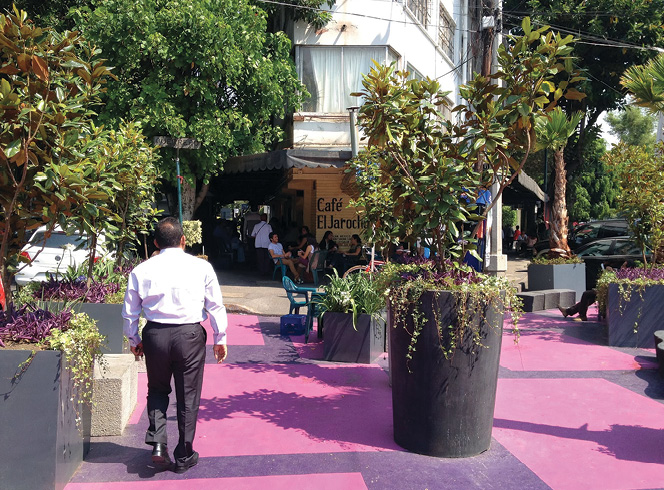
Nearby cafes, shops, and public spaces in the Coyoacan neighborhood of Mexico City encourage walking and reduce the need for vehicle travel.
Population density refers to day and nighttime population per square kilometer or other unit area. Density is not directly related to safety, but can play a role in complementing other design factors. Locating more people within walking distance of services, public facilities, and transport can help reduce the need for driving.

Greater population densities can help support mass transit and nearby uses.
Figure 2.5 | Population Density Case
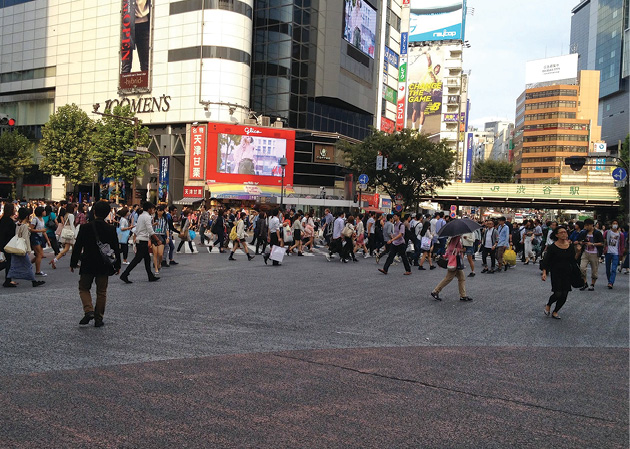
Cities such as Tokyo, near the Shibuya station here have developed high density residential and commercial areas around rail and other mass transport stations, fostering less motor vehicle use. Tokyo has one of the lowest traffic fatality rates in the world.
Lower automobile speeds, especially those below 35 km/hr, have been found to drastically lessen the risk of fatalities (Rosen and Sander 2009). Creating safer streets when cars are present means balancing the inherent tension between vehicle speeds and the safety of pedestrians, cyclists, and motor vehicle occupants alike (Dumbaugh and Li 2011).
A number of street design interventions have been found to reduce traffic speeds and improve safety. Called “traffic calming,” most of these actions can actually improve the visual aesthetics of streets (Bunn et al. 2003).
Measures we present in this chapter involve physically altering the road layout or geometry to actively or passively slow traffic. The measures can result in more attentive driving, reduced speeds, reduced crashes, improved conditions for bicycling, and greater tendency to yield to pedestrians. They also have been found to improve traffic safety in developing cities, such as Beijing (Changcheng et al. 2010). These measures are especially important around shopping areas, schools, parks and recreational areas, places of worship, and community centers. They can be applied as a network of measures in what is called area-wide traffic calming.
Traffic calming can complement other considerations in this guide regarding arterials, pedestrian and bicycling conditions, and community design. For example, reduced speeds can open up the possibility for shared streets, street plazas, wider sidewalks, bicycle lanes and other features, and alternatively, designing for pedestrians and cyclists will open up opportunities for reducing speeds.
Traffic calming measures presented in this chapter include the following:
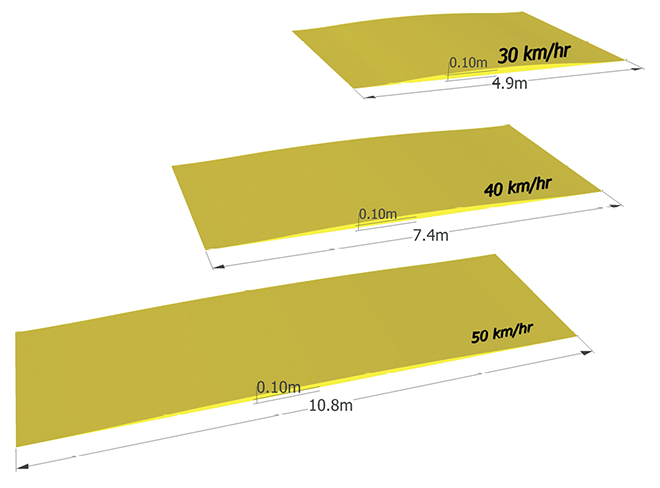
Speed humps are raised pavement that can reduce speeds to a certain limit based on the height and length of the hump. Humps are artificial elevations on the roadway. A hump is often designed as part of a circle, a trapeze, or as a sinusoidal curve. Speed humps can be designed for different target speeds, and are not limited to low traffic streets. Ideally, speed humps will enable vehicles to travel at a target speed consistently along a road, rather than slowing down and speeding up before and after each hump.
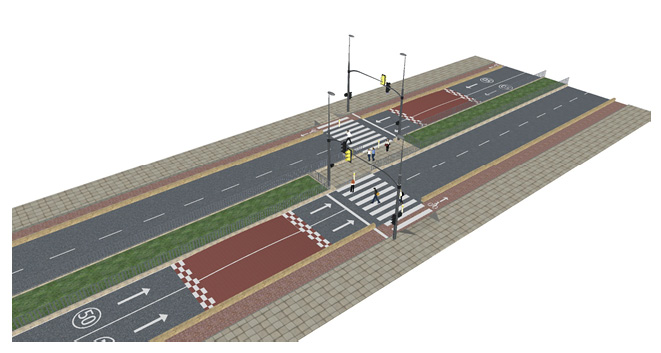
Figure 3.1.1 | Speed Humps Case
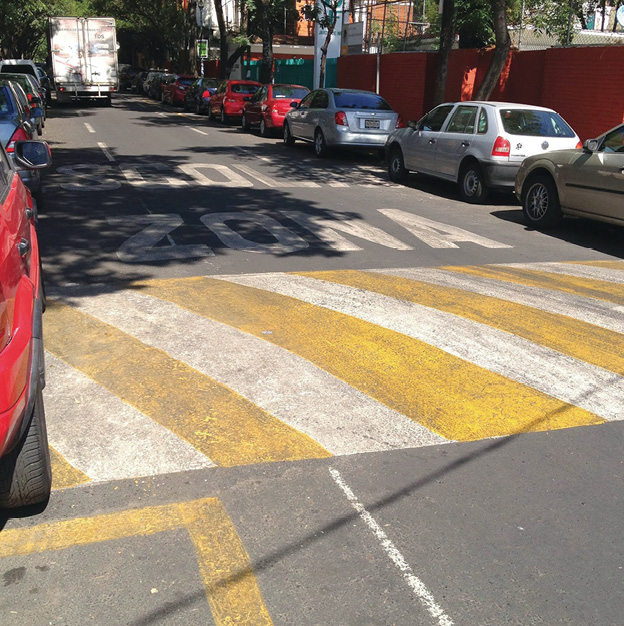
A speed hump in Mexico City near a school slows neighborhood traffic.
Figure 3.1.2 | Speed Humps Can Be Designed for Different Speeds
Speed cushions are traffic calming devices designed as several small speed humps installed across the width of the road with spaces between them. Speed cushions force cars to slow down but are different from a speed hump as they can better allow movement of larger vehicles—such as buses or ambulances—by straddling the cushions.
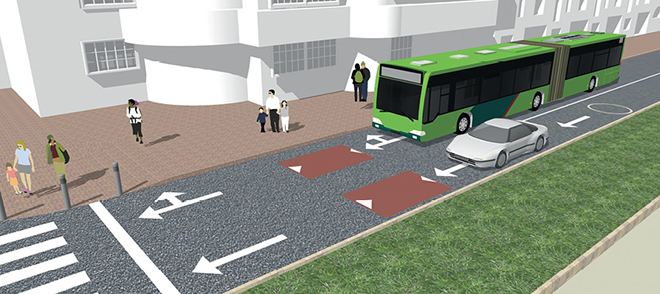
Speed cushions can allow wide-axle vehicles to pass over the cushion to increase comfort for bus passengers.
Figure 3.2 | Speed Cushions Case
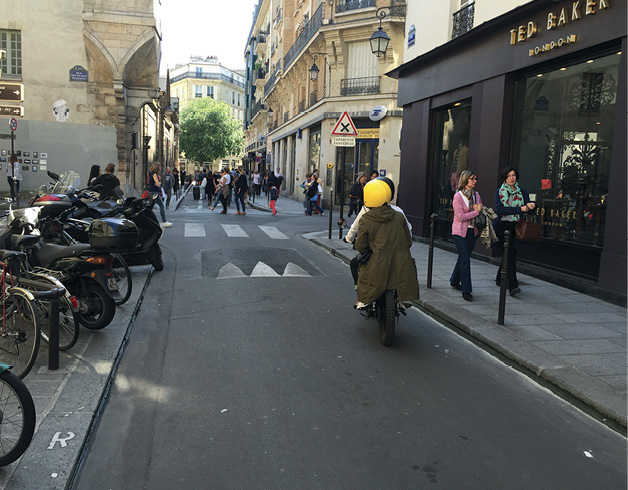
A speed cushion in Paris, France slows traffic before an intersection, providing greater protection for pedestrians.
Chicanes are artificial turns created to slow traffic. They lead to a reduction in the width of the roadway, either on one side or on both sides or constructed in a zigzag, staggered pattern that directs drivers away from a straight line, which can reduce vehicular speeds on both one- and two-lane roads.
Figure 3.3 | Chicanes Case
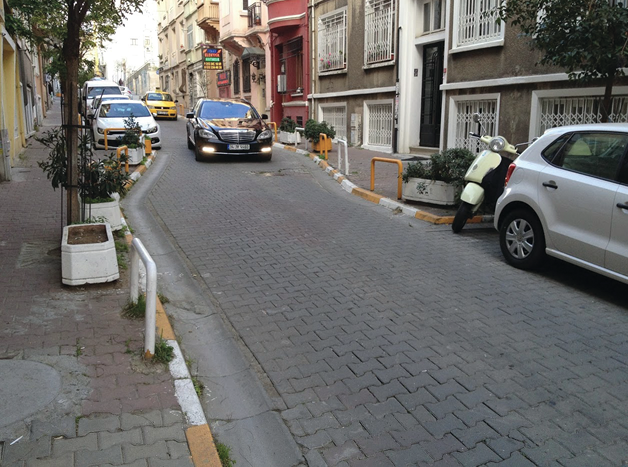
A chicane in Istanbul, Turkey creates a safer neighborhood street, staggers parking to each side of the chicane, and can contain vegetation to improve aesthetics.
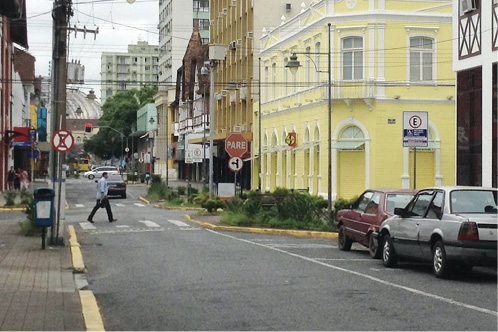
Chokers are curb extensions that narrow a street by widening the sidewalks or placing planting strips, effectively creating a pinch point along the street. They lead to a reduction in the width of the roadway, vehicular speeds, and pedestrian crossing distance.
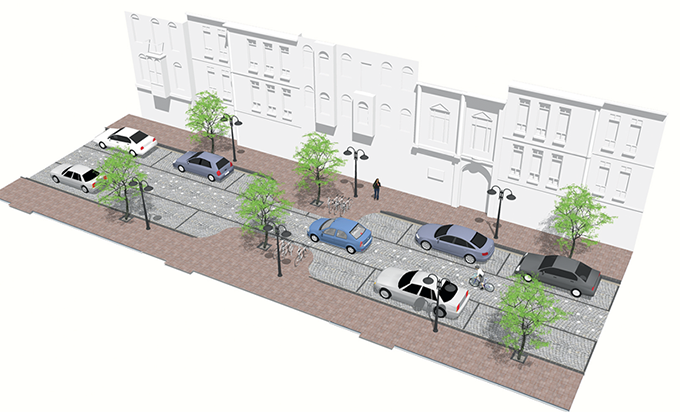
Figure 3.4 | Chokers Case
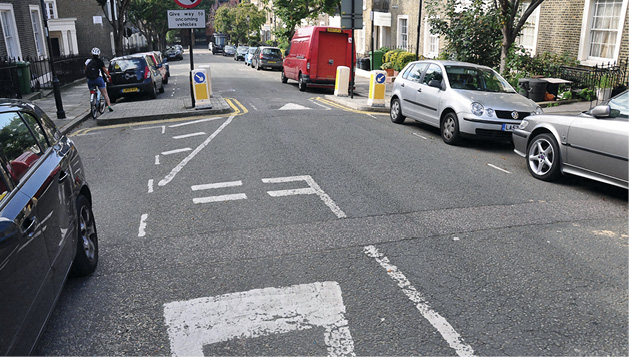
Chokers in London squeeze cars into a passage that requires them to reduce speeds. Chokers tend to extend farther into the street than regular curb extensions, aimed more at slowing traffic than reducing crossing distance of pedestrians.
Curb extensions are extensions of the sidewalk, usually at intersections that improve pedestrian visibility and reduce crossing distances. An expansion of the curb line into the lane of the roadway adjacent to the curb (typically a parking lane) for a portion of a block, either at a corner or midblock, can reduce speeds of turning vehicles and offer protection to pedestrians.
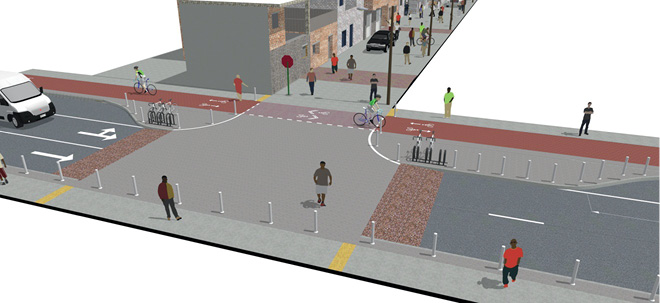
Figure 3.5 | Curb Extensions Case
A curb extension in Joinville, Santa Catarina, Brazil on a one-way street shortens the pedestrian crossing distance and creates green infrastructure to capture storm water and beautify the street.
Raised crossings are elevations of the road that slow cars as pedestrians cross, either at the intersection or a midblock location. The intersection area is raised to the same level as the surrounding pavement. Ramps are constructed on the access to the raised intersection area. Raised intersections can be combined with pavement widening, as well as bollards on the edge of the pavement to separate pedestrians and vehicles.
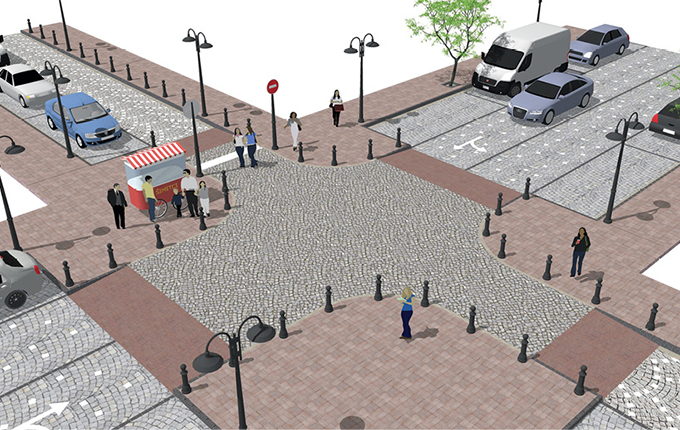
Figure 3.6 | Raised Intersections/Crossings Case
A raised crossing in Bogotá helps give priority to pedestrians and protects them from turning vehicles on an arterial street. These treatments are useful for junctions with neighborhood streets and can be combined with bicycle lanes.
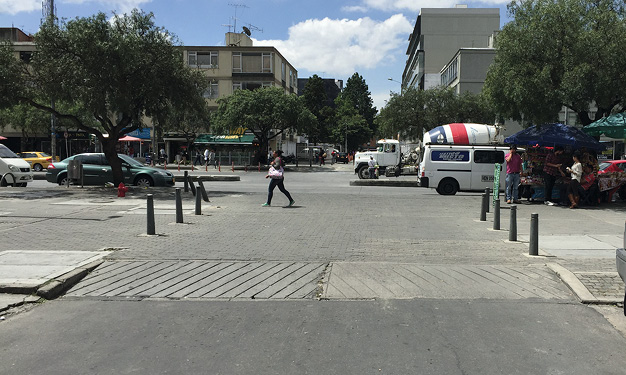
Traffic circles or rotaries are generally circular central islands in the middle of an intersection. Entering traffic must typically alter direction and speed to avoid the island, creating a circular flow in one direction. In most applications, traffic circles replace the stop lights and traffic signs that regulate flow in other intersections.
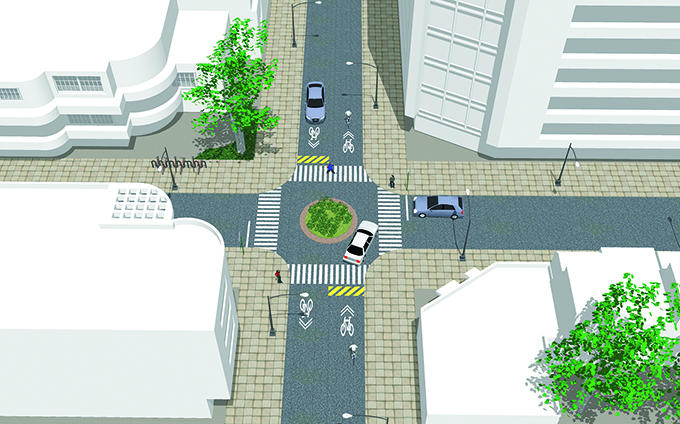
Figure 3.7 | Traffic Circles Case
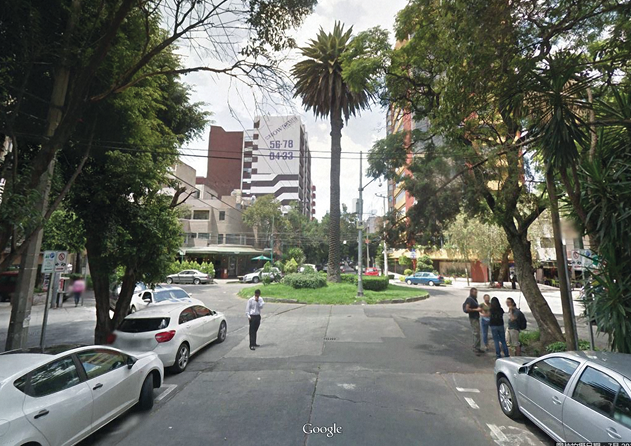
A traffic circle located in the Hipódromo neighborhood of Mexico City, Mexico calms traffic, provides a space for greenery, and reduces conflict points through eliminating left turns.
Roundabouts reduce conflict points at four-armed intersections and slow traffic. A roundabout is a road intersection with circulatory traffic. The traffic passing through the intersection is regulated in one direction anti-clockwise (in countries driving on the right) around a circular traffic island placed in the center.
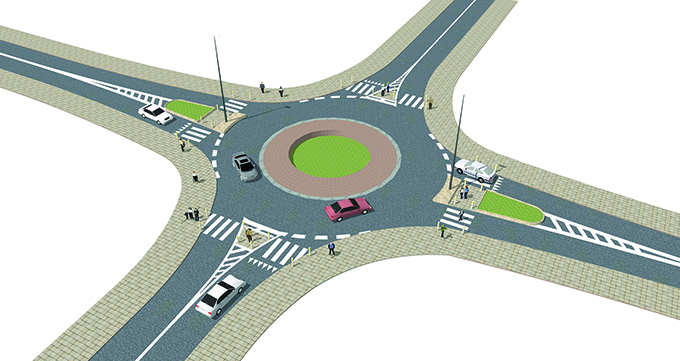
Figure 3.8 | Roundabout Case
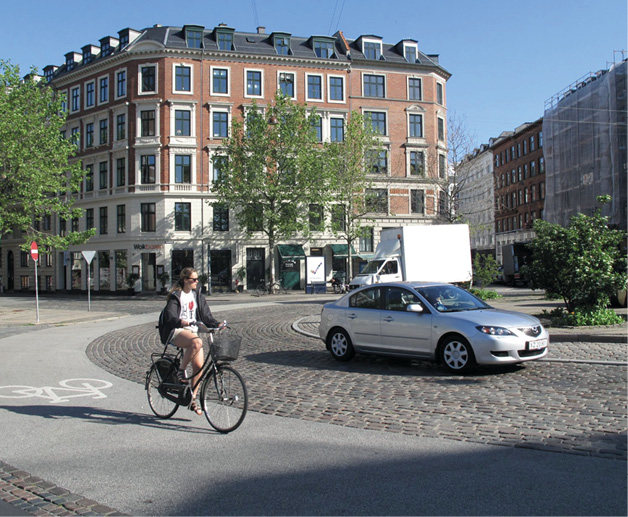
A roundabout in Copenhagen, Denmark includes a bicycle lane.
Urban arterials are the most common location for severe pedestrian and motor vehicle collisions, given the volume of road users and often higher speeds of vehicles. These streets are often designed first for motor vehicles rather than pedestrians and bicyclists. The relatively high speeds on arterials exacerbate the severity of injuries that occur on these streets.
On streets with mixed traffic—motor vehicles, pedestrians, and bicyclists—all road users have to be considered in designing safer streets. In places such as the United States and Mexico, the concept of Complete Streets has been used to think about streets that are holistically safer for everyone. This concept is based on the principle of shared public space and use. It focuses on safe access, an attractive streetscape, and effective mobility for all street users, including pedestrians, bicyclists, motorists, and transit riders of all ages, gender, and abilities.
The Complete Streets concept puts a priority on active transport, making it easier for people to cross the street, walk to shops, and bicycle. They are also designed around efficient street networks and context-sensitive solutions, allowing buses to run on time and making it safe for people to walk to and from transit stations. Complete Streets coordinate all street elements—infrastructure, paving, street furniture, signage, lighting, trees, and vegetation—for the use, enjoyment, and understanding of the public realm.
Notwithstanding the variety of street types a city has, the Complete Streets concept aims to offer as many possible choices for safe transit as possible to the widest range of users, seeking a balance in their levels of service. Complete Streets must then be designed with the following in mind:
The condition can be worse in low-and-middle-income countries, where signalization and crossing design may not consider pedestrians and bicyclists, features such as median refuge islands are missing, turning movements are not considered, vehicle design speeds are high, and road striping can be unbalanced or confusing.
There are some key considerations for arterials and higher volume corridors that can impact safety. This includes designing crossings that consider how pedestrians move, providing medians and refuge islands, and ensuring lane balance—meaning a road will not have two lanes on one side of an intersection and three on the other. There are also considerations about how junctions (also called intersections) are signalized and designed to reduce crossing distance.
New development can limit the number of arterials and ensure they are designed for safer conditions and preference toward pedestrians and cyclists, while existing arterial streets can often be reoriented toward the more efficient movement of mass transport, pedestrians, and bicycles.
The needs of all road users should be considered on streets where vehicle, pedestrian, and bicycle traffic are mixing. The following basic considerations for arterial corridors and junctions are discussed in this chapter:
Urban arterials generally have more travel lanes and higher speeds, compared to neighborhood or local streets, and most intersections are signalized. Urban arterials are major and minor thoroughfares that carry higher traffic volumes. These streets often have surface transit routes, retail, and high numbers of pedestrians and cyclists. Prioritizing the safety and comfort of pedestrians, cyclists, and transit is key to achieving mobility goals for all road users in cities.
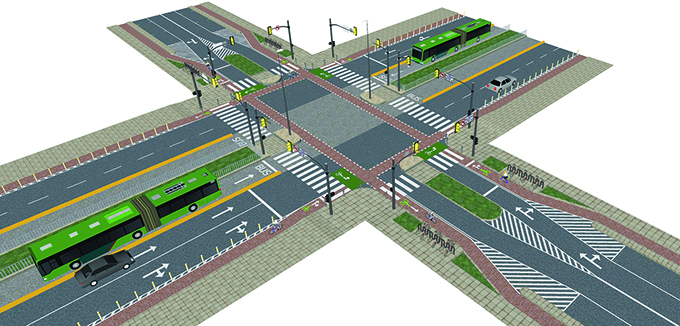
Arterial with central median, restricted left turns, and dedicated bus lane.
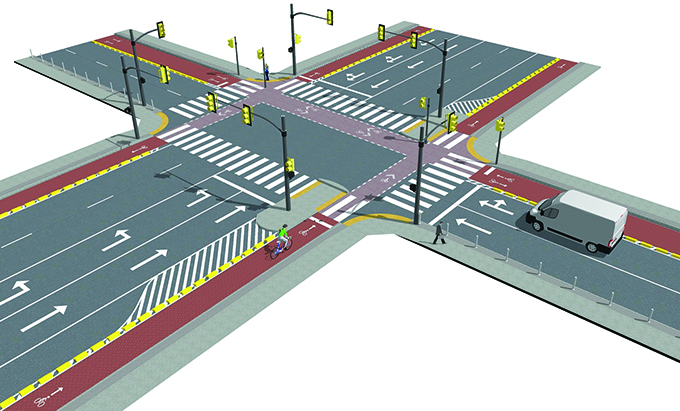
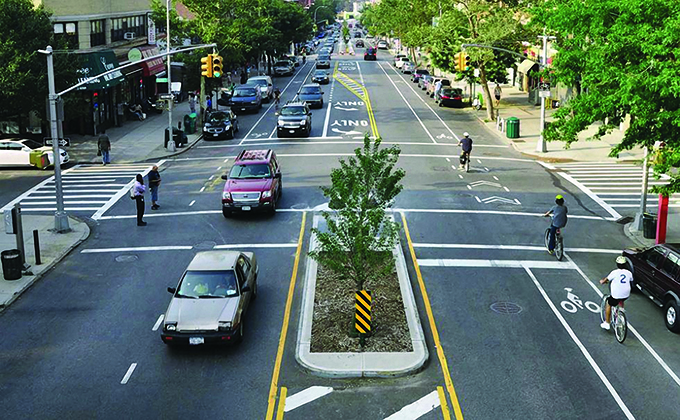
Figure 4.1 | Arterials Case
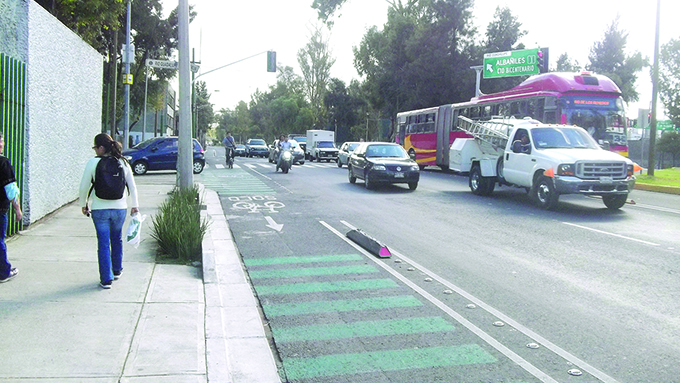
Avenida Ing. Eduardo Molina in Mexico City—an arterial with dedicated bus lanes, protected bike lanes, rebuilt sidewalks, and a green central median at some segments—accommodates mass transport, mixed vehicular traffic, bicycling, and walking.
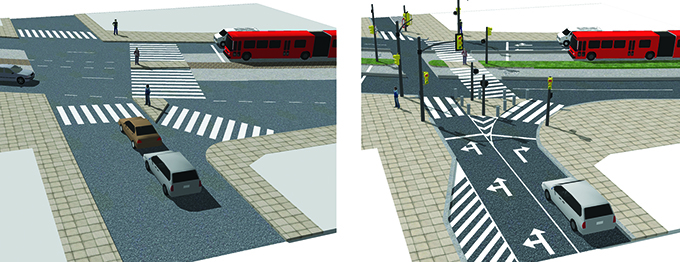
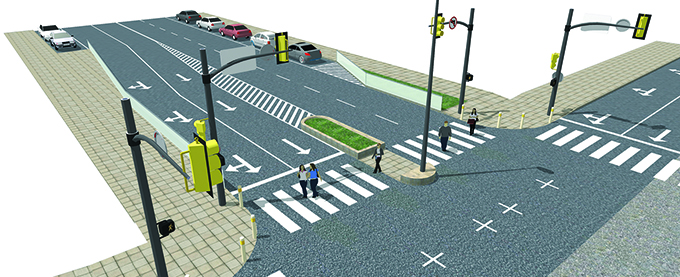
Multimodal intersections operate with pedestrians, bicycles, cars, buses, and trucks, and in some cases trains. The diverse uses of intersections involve a high level of activity and shared space. Crossings should be direct and as short as possible for pedestrians to safely reach the other side of the street. The goal is to minimize pedestrian exposure and to provide a safer, marked area for when they are exposed.
Arterial with central median, restricted left turns, and dedicated bus lane.
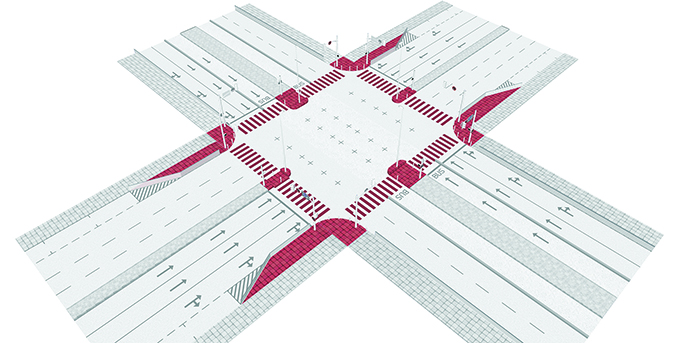
Figure 4.2 | Pedestrian Crossings Case
Providing curb extensions and median refuges decrease crossing distance and reduce exposure to moving vehicle traffic.
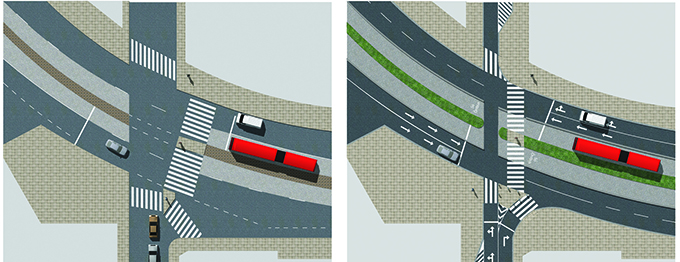
Figure 4.2.2 | A Before and After of Crossing Designs, Creating Direct and Shorter Paths
Medians are barriers in the center portion of the street or roadway separating different lanes and traffic directions. The widths and design of medians can vary greatly. They can range from narrow concrete curbs to tree-lined promenades to landscaped boulevard medians.
Central median refuge, seen on a 4-lane road; applicable to two-lane roads as well.
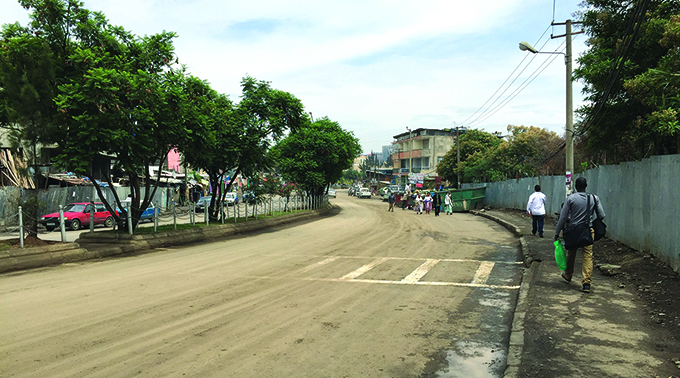
Figure 4.3 | Medians Case
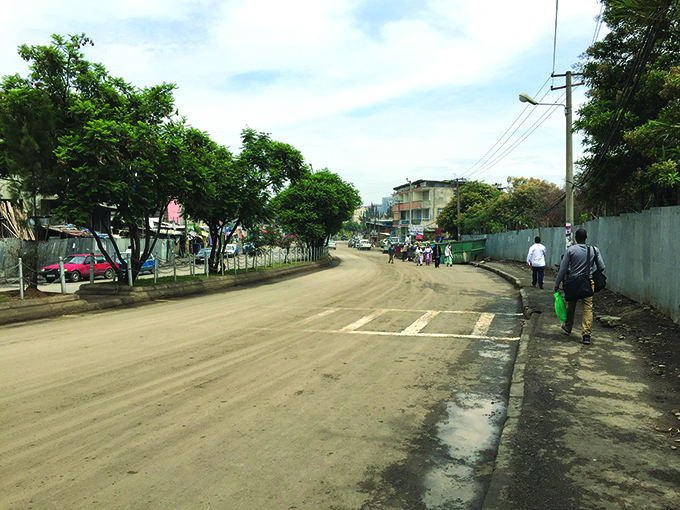
A central median with trees in Addis Ababa helps green the street, prevent conflicts between vehicles and provides a refuge for pedestrian crossings. The pedestrian refuge area should be at-grade to improve pedestrian comfort and accessibility. While this road lacks other features that could improve pedestrian conditions, the median provides a basic level of safety.
Pedestrian refuge islands are short segments of median used at pedestrian crossings for pedestrian refuge. Medians or pedestrian refuge islands are designated places in the middle of the street for pedestrians who cross a street midblock or at intersections.
Central median refuge without a continuous median.
Figure 4.4 | Median Refuge Islands Case
A median refuge island gives pedestrians a safer place to wait for crossing in Paris. Islands can be used at signalized or unsignalized junctions, as well as mid-block.
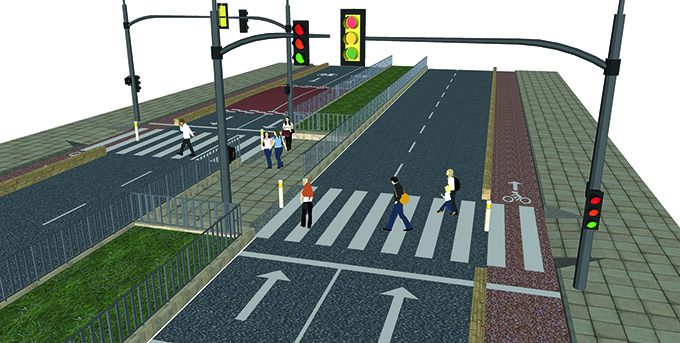
Traffic signal control at inter-sections separates different flows of traffic from each other, and can improve vehicle and pedestrian safety at intersections. Traffic signal control can be time-controlled (phase change after a given time, regardless of the traffic volume) or actuated by vehicles, bicyclists, or pedestrians. Special signal times for pedestrians and bicycles can be provided.
Signal poles at intersection.
Figure 4.5 | Signal Control Case
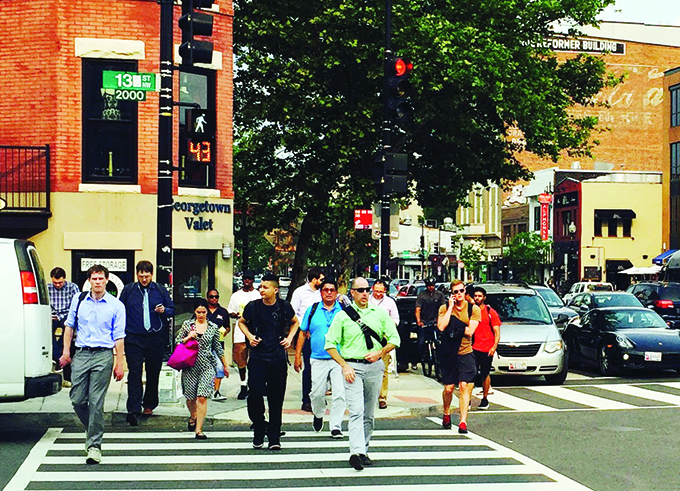
A Lead Pedestrian Interval from Washington, D.C. shows the walk signal for pedestrians to begin 3 or more seconds before the green phase for vehicles.
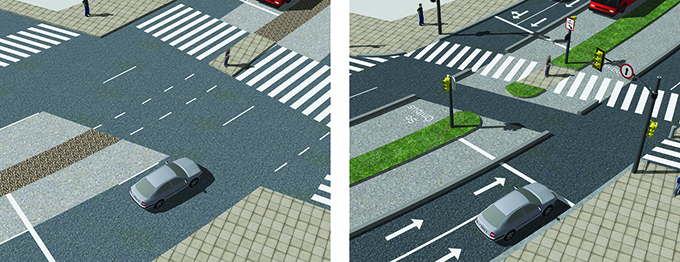
To avoid traffic conflicts through an intersection, there should be a balance in the number of lanes entering and exiting the intersection. Lane imbalance occurs when the number of lanes entering an intersection along any given approach or turning movement is larger than the number of lanes exiting the intersection along that same movement (i.e. continuing straight, turning left, etc.).
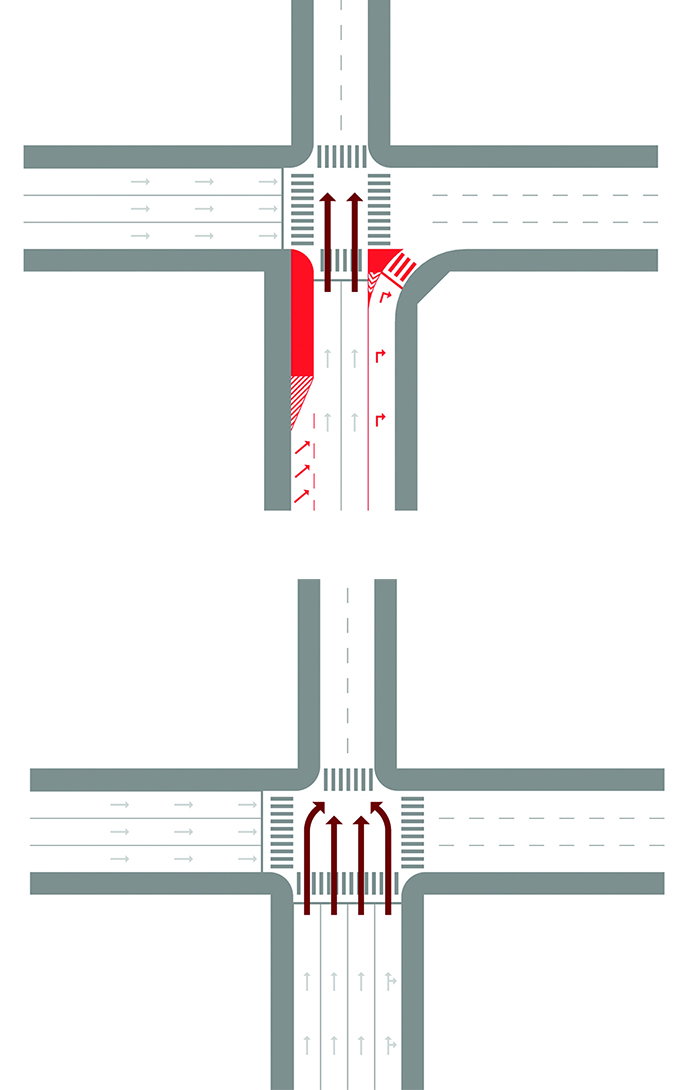
Example of how lane imbalance (above) can be addressed by taking out lanes on one approach, or creating turn-only lanes (below).
Figure 4.6 | Lane Balance Case
On this street in New York City, the number and symmetry of lanes are aligned on both sides of the junction.
Many cities face the pressing challenge of growing motorcycle fleets and significant increases in motorcycle-related traffic fatalities. Latin America’s motorcycle deaths tripled in the 2000s—most evident in places like Brazil and Colombia (Rodrigues et al. 2013). In Malaysia—where motorcycles make up roughly half of the country’s vehicle fleet—two- and three-wheelers make up 59 percent of its nearly 7,000 annually reported traffic deaths. Similar trends are occurring in India, Vietnam, Indonesia, and other countries worldwide.
Motorcyclist behavior is one problem that, when changed, can reduce traffic deaths—especially through laws and campaigns for helmet wearing, driver education, and licensing (Passmore et al. 2010). With this guide focused on design solutions to traffic safety, are there specific infrastructure considerations when it comes to motorcycles? There is a need for more research and attention to motorcycle safety design solutions, and how they impact other modes of transport such as mass transport and bicycling. Though research is limited, we present an overview here of some infrastructure and mobility issues.
Street design for motorcycle safety
Some infrastructure has been shown to be effective at reducing motorcycle crashes, such as exclusive motorcycle lanes on trunk roads in cities in Malaysia—a practice that has been replicated in Indonesia and the Philippines (Radin Umar 1996; Radin Umar, Mackay, and Hills 1995; Sohadi et al. 2000). It isn’t known if these exclusive lanes are appropriate in other locations, or on urban streets other than the primary roads. Barranquilla, Colombia created some exclusive lanes but little evidence is available on their effect. In São Paulo, the results of exclusive lanes have been described as mediocre, though the city did see a reduction in crashes when it banned motorcycles on the central lanes of a main expressway (Vasconcellos 2013). In London, the city opened bus lanes to motorcyclists and found that crashes increased in a first trial, but did not significantly increase after a second trial (York and Hopkins 2011).
Research seems to show that the measures that improve safety for all road users also apply to motorcyclists, such as reducing speeds through traffic calming and limiting vehicular traffic. One reason motorcycles are so dangerous is that they zig-zag in between and around cars, moving unpredictably at higher speeds. A study from Malaysia found that an increase in the speed at which vehicles approach signalized intersections is associated with more motorcycle crashes, and that more motorcycle crashes occur at signalized intersections located within commercial areas (Harnen et al. 2004). Slowing all vehicles to safer speeds before signalized intersections— particularly in retail areas—may do a great deal to improve motorcycle safety.
Addressing the larger issue of urban mobility
Motorcycles are a preferred option for many to get from one point to another where public transport is very poor quality, inaccessible, or nonexistent. In Hanoi, for example, a study showed that employment opportunities are much less accessible by public transport than by motorcycle or car, which explains why Hanoians “like” to use motorcycles instead of public transport (Nguyen et al. 2013). In addition, in Brazil, many travelers use motorcycles instead of public transport due to lower costs or the poor quality of public transport in their city—finding that overall motorcycle operating costs were 25 percent lower than bus fares (Vasconcellos 2013). And in Pune, India an EMBARQ India study showed that two-thirds of two-wheeler riders surveyed said they used public transport prior to using two-wheelers (Pai et al. 2014). The same study indicated that motorcycle riders would shift to public transport if it were made more reliable, comfortable, frequent, and clean.
Moreover, because many urban trips are short, providing safer bicycling and walking facilities or connecting these modes to mass transport can give residents alternative mobility options. The guidance in this report may help achieve this, but there is much more research needed in order to determine exactly how motorcycle safety can be addressed in terms of infrastructure and mobility.
Nearly all trips begin and end with walking. But pedestrians have often been overlooked when planning for transport.
WHO reports show that each year, more than 270,000 pedestrians lose their lives on the world’s roads (WHO 2013). Pedestrians are most at risk in urban areas due in part to the large amount of pedestrian and vehicle activity occurring and concentrated in cities (Zegeer and Bushell 2012). This is especially the case in developing countries, where urbanization is speeding up. For example, due to the growing parking demand in rapidly motorizing countries, sidewalks are commandeered for parking and public space converted into parking lots, pushing pedestrians into the street. Many cities’ sidewalks are poorly maintained or not maintained at all. In India, statistics show that the pedestrian fatality share is over 40 percent in metropolitan areas like New Delhi, Bangalore, and Kolkata (Leather et al. 2011).
Any plan to address safety needs to address pedestrian safety. The European Traffic Safety Council, for example, recommends policies of modal priority for road users, particularly in urban environments, and that a hierarchy based on safety, vulnerability, and sustainability place pedestrians at the top, followed by cycling and public transport (ETSC 2014; Paez and Mendez 2014).
Walking also has great health and environmental benefits. It reduces the incidence of non-communicable diseases, is nearly carbon-emissions free, and pedestrians support street-level retail businesses. This chapter aims to provide some basic guidance on how streets and public spaces can be provided and designed to foster a safer pedestrian environment. The following sections are covered:
EMBARQ conducted household surveys in 2010 and 2011 on the conditions of the built environment in the catchment areas of four forthcoming BRT corridors in four cities around the world. Though the results may have regional differences and local issues that impact numbers, the consistent theme across all of them is that few residents feel safe from traffic on city streets or are satisfied with the condition of sidewalks (figure 1.5). Providing safer community and street designs through transit-oriented development around these corridors is one way that could improve the perception of safety and opinions of pedestrian facilities.

Sidewalks, pavement, or footpaths are portions of a street between the curb lines and the buildings for use by pedestrians. A well-equipped sidewalk accommodates pedestrian use and street furniture, as well as landscaping elements, including light poles, signs, fire hydrants, benches, mail boxes, newspaper boxes, parking meters, trash cans, etc.
Basic sidewalks provide a separate area for pedestrians without parked cars.
Figure 5.1.1 | Safe Sidewalks Case
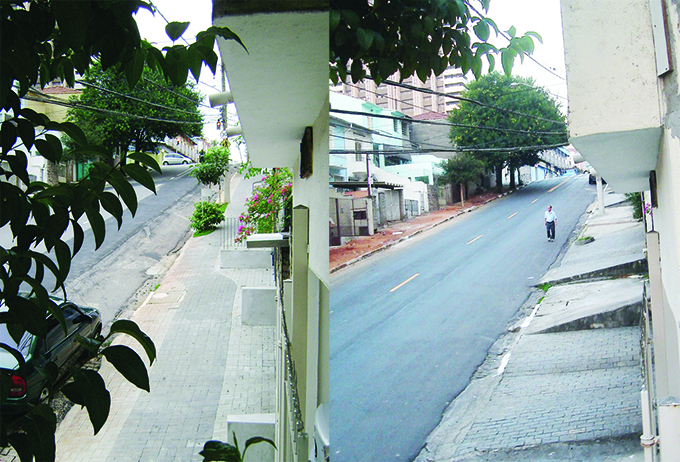
These before and after photos show the sidewalk of a street in São Paulo that was reconstructed to remove obstructions and uneven steps, and improve access, continuity, and appeal. The project was part of the Calçadas Verdes e Acessíveis (Green and Accessible Sidewalks) project.
Figure 5.1.2 | Safe Sidewalks Case
A sidewalk in Mexico City provides the basic comforts of even pavement, segregation from the street and trees, and is designed to prevent vehicles from commandeering the space.
Table 5.1 | Sidewalk Widths for Different Pedestrian Capacities
| capacity in persons per hour | ||
|---|---|---|
| all in one direction | in both directions | minimum width of sidewalk in meters |
| 1220 | 800 | 1.50 |
| 2400 | 1600 | 2.00 |
| 3600 | 2400 | 2.50 |
| 4800 | 3200 | 3.00 |
| 6000 | 400 | 4.00 |
Source: UNEP (2013), CSE (2009).
Shared streets often are referred to as “pedestrian-priority streets”, “home zones”, or “woonerfs.” The street is shared by all users, designed to foster safety. Shared streets are designed to dramatically slow traffic through treatments such as brick paving, planters, and curves, in order to give priority to pedestrians over motorists and create awareness among all users.
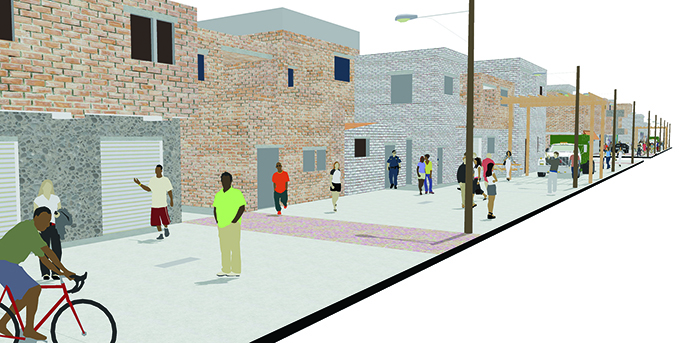
Figure 5.2 | Shared Streets Case
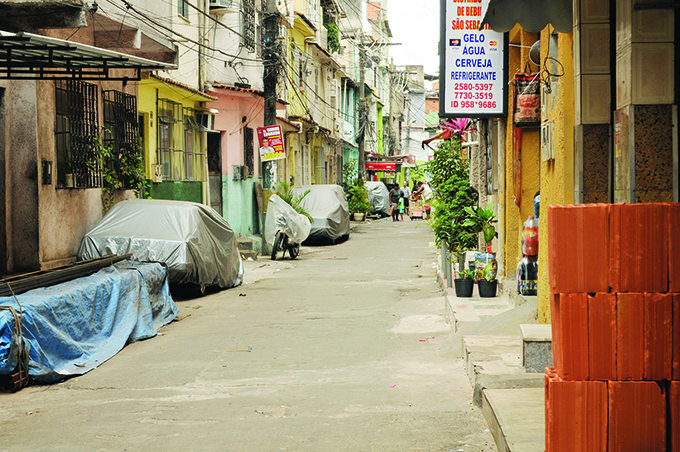
The streets of Rio de Janeiro’s favelas often function well as shared streets, and though they may lack some traffic calming features of traditional shared streets, when upgraded can contain such features. EMBARQ/WRI research shows residents feel safer from traffic here than in the formalized city.
Pedestrian streets also are referred to as “pedestrian malls”, “auto-free zones”, or “car-free zones” that are reserved for pedestrian use only. All automobile traffic may be prohibited on pedestrianized streets and zones, except delivery trucks at night or another period of day, and emergency vehicles.
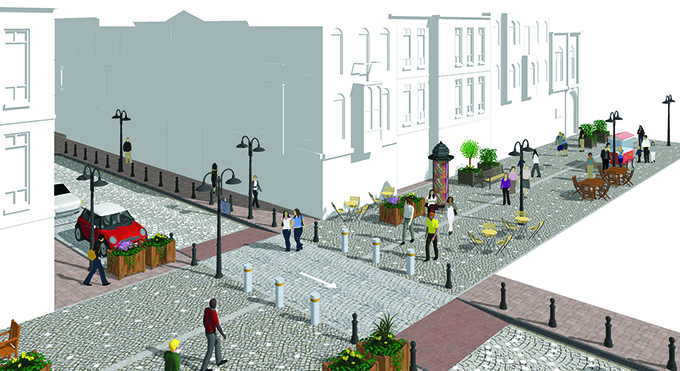
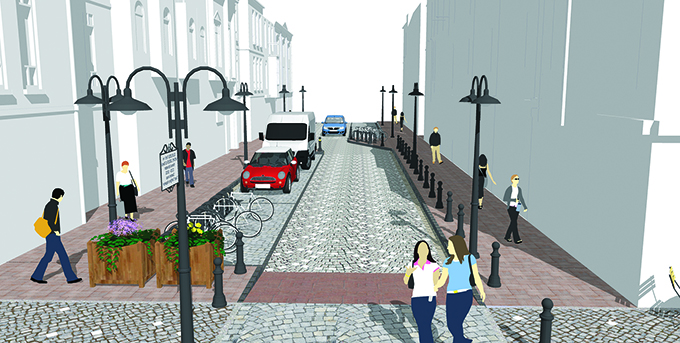
Figure 5.3 | Pedestrian Streets and Zones Case
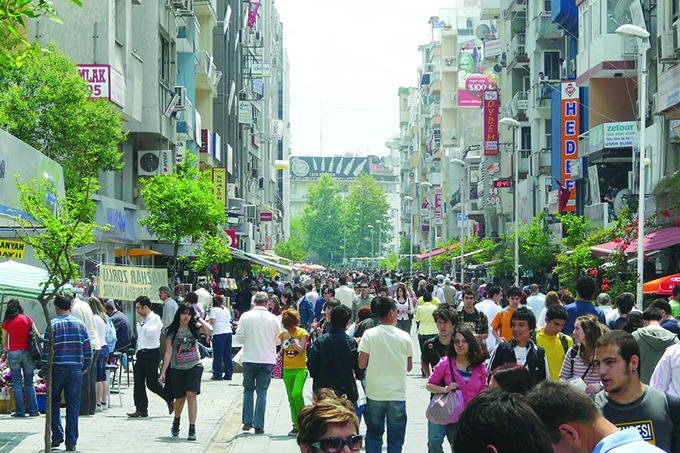
A pedestrian street in Izmir, Turkey provides a place to shop and be out in the city safely away from vehicle traffic.
Zones around children’s playgrounds, parks, schools, and community centers are areas that require special attention to pedestrian safety. Children are more vulnerable than adults to collisions with motor vehicles, because their activities and movements are more unpredictable.
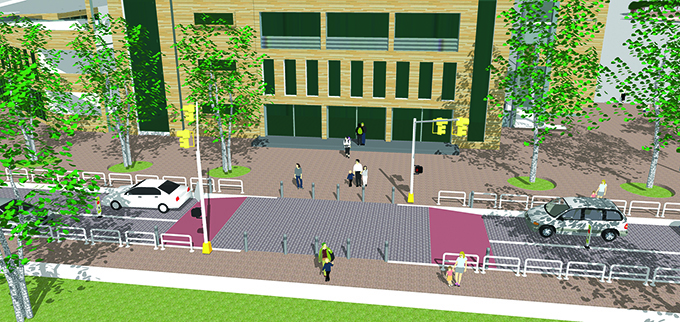
Figure 5.4 | Safe Places to Learn and Play Case
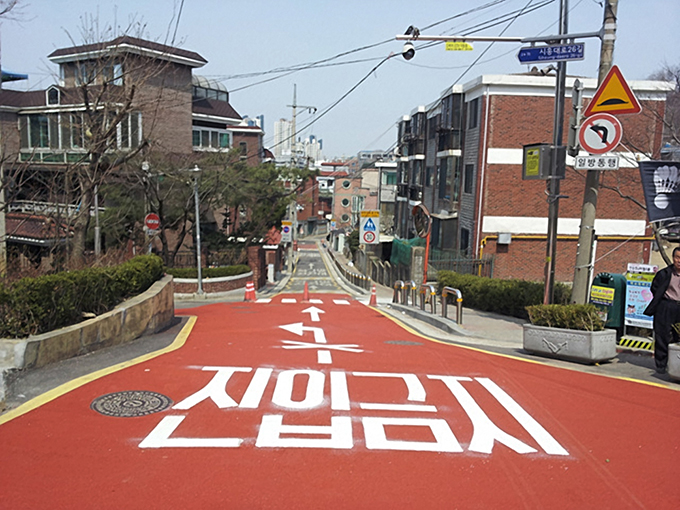
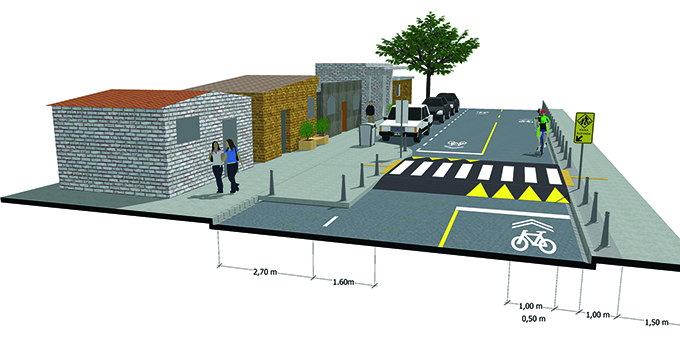
This narrow street in a school zone in Seoul has a clearly marked roadway (here translated as “school zone—slow down—30km/hr”) and sidewalk protection fences, creating a safe walking environment for children.
Ciclovias—also referred to as “Ciclovias recreativas” in Latin American countries—temporarily open streets exclusively for people for cycling, skating, walking, jogging, or other activities. Open streets are a recent initiative that shows promise in addressing the global concern about lack of physical activity and in providing safe recreational places on weekends.
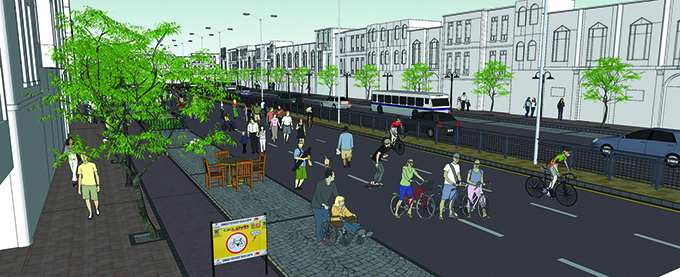
Figure 5.5 | Open Streets Case
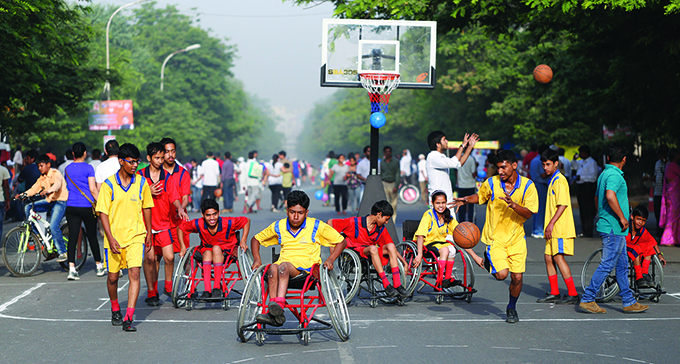
Participants play basketball on a street closed to automobiles as part of Raahgiri Day in Gurgaon, India.
Street plazas— also referred to as “pedestrian plazas” or “pocket parks”—are abandoned small residual urban or road areas that were converted into public spaces.
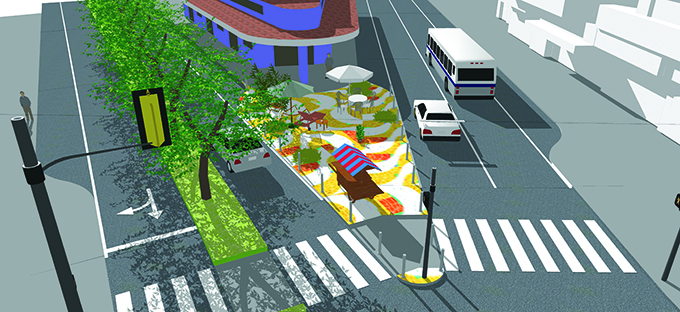
Mexico street plaza.
Figure 5.6.1 | Street Plazas Case
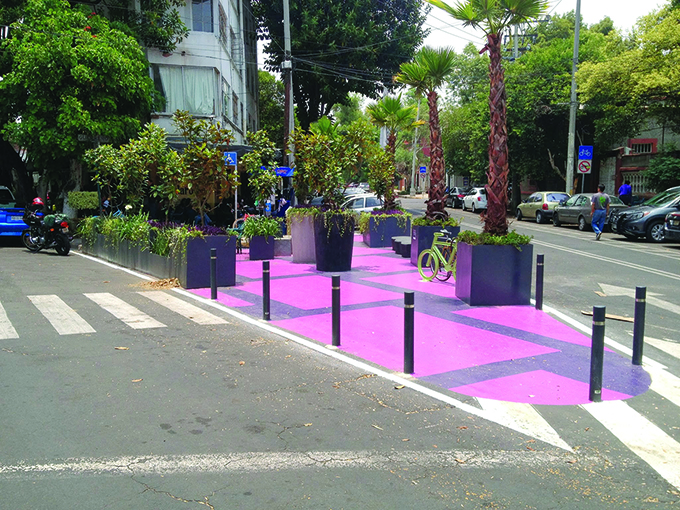
A street plaza in Coyoacan, Mexico City provides public space for people, helps calm traffic and reduces pedestrian crossing distance.
Figure 5.6.2 | Street Plazas Case
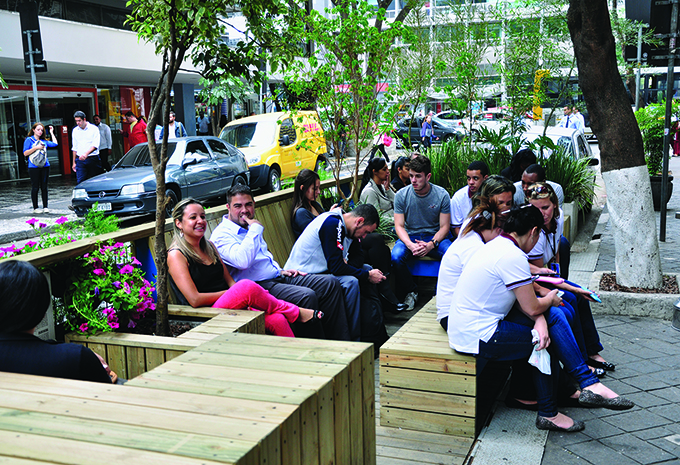
A variant of the street plaza is the parklet (a term used in the United States and Brazil). Seen here in São Paulo, parklets are part traffic calming (sharing characteristics with curb extensions and chokers) and part public space improvement. This parklet in São Paulo was created by taking away vehicle parking spaces and was built to be level with the sidewalk with seating and greenery.
Streets make up approximately 25 percent of New York City’s land area and yet, outside of parks there are few places to sit, rest, socialize, and to enjoy public life. To improve the quality of life for New Yorkers, the City creates more public open space by reclaiming underutilized street space and transforming it into pedestrian plazas.
In addition to the plazas shown on this page, there are twenty-six plazas that are in some phase of planning, design, or construction with three additional plazas expected each year. The most high-profile pedestrian plazas are improving quality of life and safety for New Yorkers and tourists at Times Square, where the City is preparing to make permanent the public space enhancements that were installed as part of a six-month pilot during the summer of 2009.

Bicyclists require special attention in street design as they are one of the most vulnerable users in terms of traffic fatalities and injuries, yet an increase in safety and usage can lead to greater health and environmental benefits.
Bicycling in many cities is a main form of transport. Asian cities once had a great legacy of bicycling, but this is on the decline in China and increasing in the United States and other developed European countries. Research has shown that U.S and European cities with higher rates of bicycling have fewer overall traffic crashes, and these cities are also home to connected streets and advanced networks of bicycle lanes, off-street paths, ample bike parking, and bicycle sharing systems. This chapter will be focusing on some key issues in providing safer conditions in a bicycle system, using examples and evidence from both the developed and developing countries. The following sections will be included:
Evidence shows that the crash rate for cyclists is six to nine times as high as for car users (Bjornskau 1993). The risk may be even higher in developing countries due to underreporting. Evidence also shows that through better street design, bicycle injuries and crashes can be greatly reduced. While protected bicycle lanes seem to improve safety through numbers by giving users a perceived security and increased safety between junctions, paying special attention to junction design is crucial for real gains in safety. This includes improving the visibility between cyclists and vehicle drivers and addressing conflicts at junctions with proper markings and signalization. Combining these measures will ensure a safer, more pleasant, and ultimately more successful bicycling system.
The needs of bicyclists should be considered throughout the road network. A well-connected bicycle network should consist of interconnected bike lanes, cycle tracks, traffic-calmed streets with priority for bicycles, and special considerations at junctions and intersections, which are designed to prioritize cyclists’ needs.
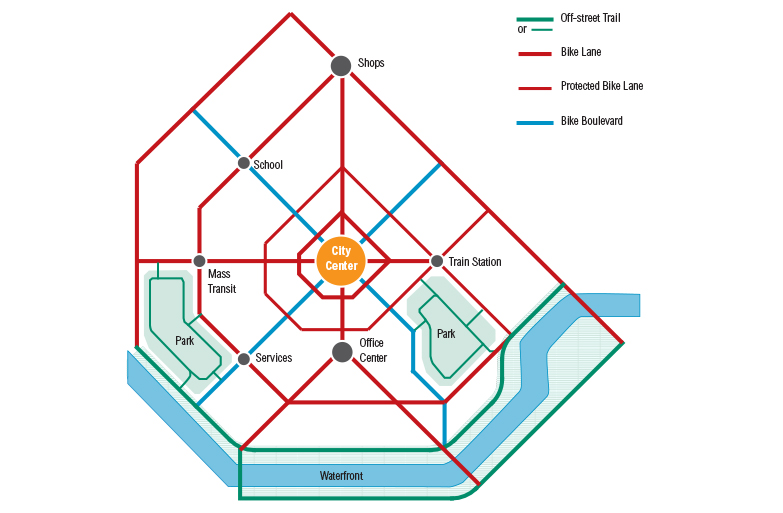
Diagram of a bike network that connects important destinations.
Figure 6.1 | Bicycle Networks Case
Curitiba, Brazil has more than 120 km of bicycle lanes and paths, traversing both green areas and city streets. The city is planning another 200 km, linking destinations, transport nodes, and residential areas in a consolidated network.
A portion of the street in one or both traffic directions is designated for exclusive bike use by pavement markings (bike lanes), or a curb or median (cycle tracks). Protected bicycle lanes are intended to physically separate cyclists from motorized traffic and to ensure cyclists mobility and a feeling of security when traveling.
Cycle tracks separated from car traffic through physical barrier.
Figure 6.2 | Bike Lanes and Cycle Tracks
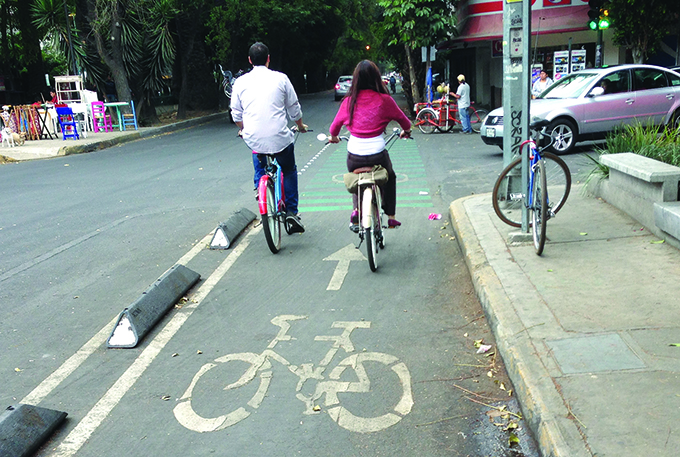
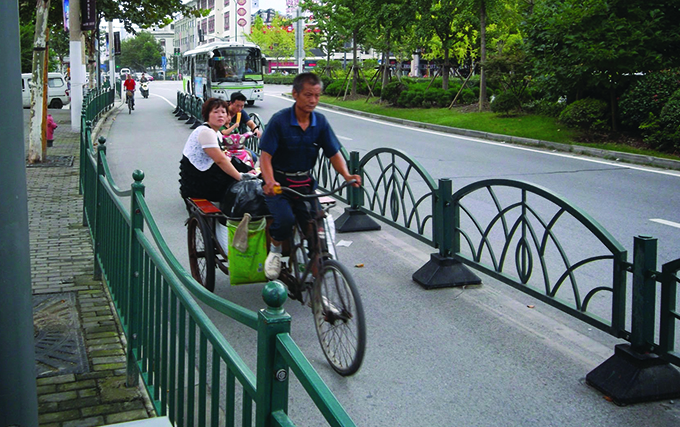
A one-way cycle track from Mexico City protects bicycles with physical barriers and markings where the barriers give way at a vehicle access point. Bottom: Cycling infrastructure seen here in Shanghai, China provides physical separation from motor vehicles through a fence. Pedestrians are also kept from entering the area.
A path is provided in an off-street location that is exclusive to bicycles and pedestrians. Off street trails are sometimes called greenways or green routes and located on linear corridors, parks, utility or former rail corridors, along streams or waterfronts.
An off-street trail that segregates bicyclists and pedestrians to reduce conflicts.
Figure 6.3.1 | Off-Street Trails Case
A bidirectional lane along the edge of a park in Belo Horizonte, Brazil allows the adjacent path to be solely devoted to pedestrians. The bicycle lane is protected from motor vehicle traffic with concrete separators. Bidirectional lanes are most applicable when along corridors such as parks and waterfronts where turning conflicts are fewer.
Figure 6.3.2 | Off-Street Trails Case
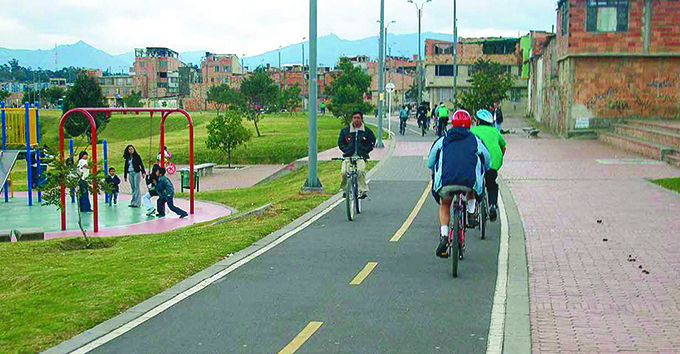
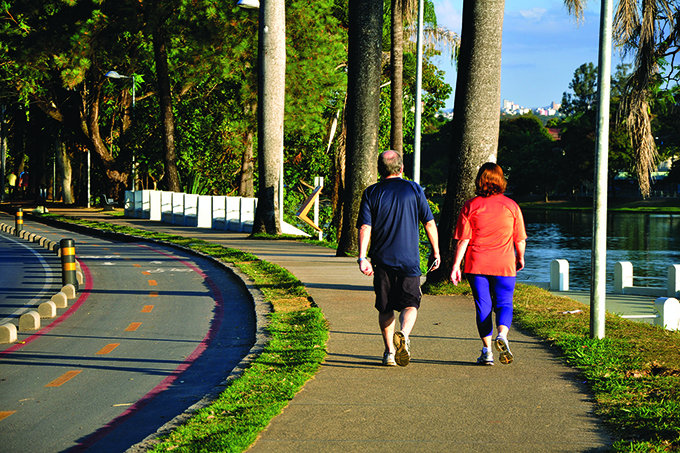
This off-street bike trail on the edge of a park in Bogotá, Colombia provides separate paths for pedestrians and cyclists, helping to reduce conflicts between the users.
Shared bicycle streets—also known as bicycle boulevards—are low-vehicle-volume and low-speed streets that have been optimized for bicycle travel through treatments such as traffic calming, vehicle reduction and redirection, signage and pavement markings, and intersection crossing treatments.
A shared bicycle street, bike boulevard design with road markings and traffic calming measures.
Figure 6.4 | Shared Bicycle Street Case
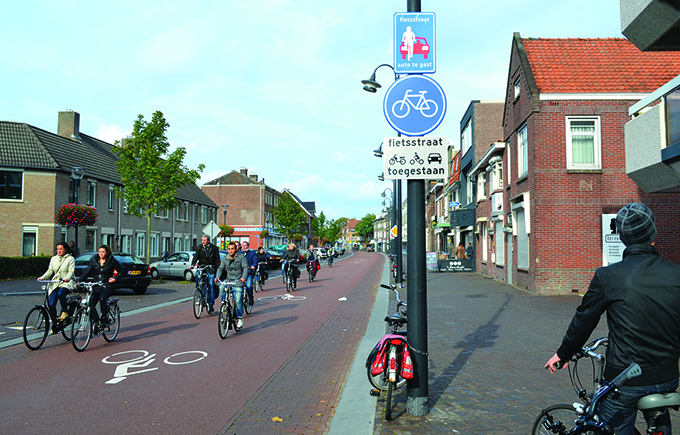
A fietsstraat (bike way) in the Netherlands has pavement markings and signage of a bike boulevard.
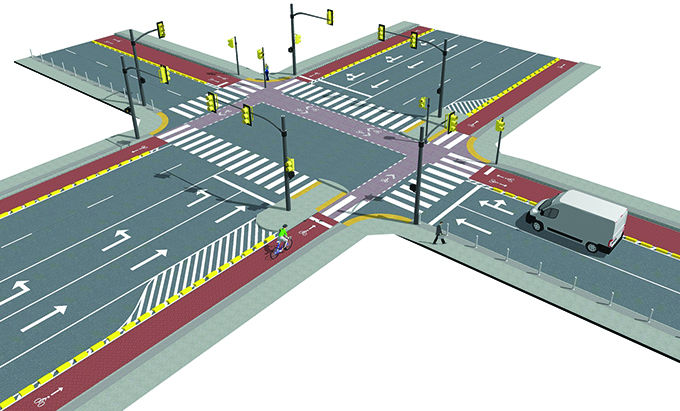
A safer intersection for bicyclists may include elements such as colored pavement, markings, bike boxes, bicycle signals, and simultaneous green phases for cyclists. Special attention to bicycle facilities at intersections and driveways should be given to maintain visibility of the bicyclists to motorists and to reduce the risk of turning conflicts with motor vehicles.
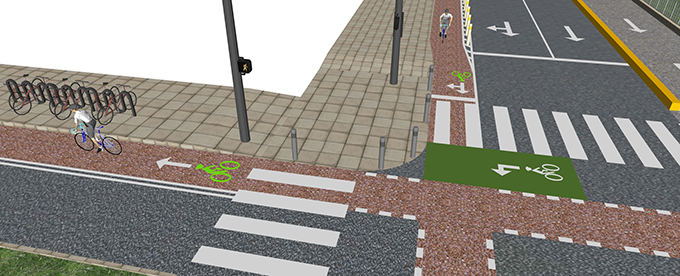
An intersection enhances the view between drivers and cyclists as they approach the intersection, and a two-step left-turn box.
Figure 6.5 | Bicycle Safety at Intersections Case
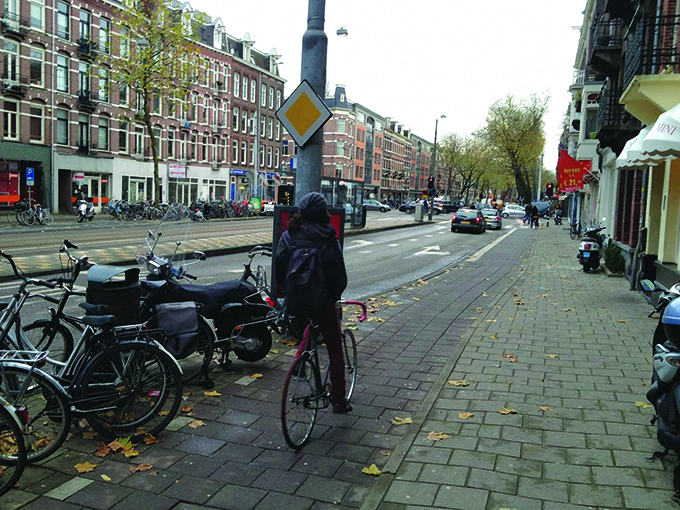
An intersection in Amsterdam is designed to show visibility between cyclists and vehicles, with the parking lane gradually eliminated to improve visibility between motorists and bicyclists.
Left turns are one of the more complicated movements at intersections, and it is important to know the varying safety aspects of certain designs.
Some guidance, such as the NACTO Urban Bikeway Design Guide from the United States, outlines bicycle boxes where cyclists are placed ahead of cars to make a left turn (NACTO 2013). Similarly, manuals from Ireland and the Netherlands describe an option where cyclists weave into a feeder lane for a left turn, though this places cyclists at risk while turning (CROW 2007; NTA 2011).
A safer design may be found in two-step turns. Guidance from the Netherlands indicates that two-stage left turns are one option that can reduce the conflicts (CROW 2007). A national-level guide for Mexican cities also suggests this design (ITDP 2011). Research from China also shows the two-step design to be beneficial (Wang et. al 2009). One problem is that this can leave cyclists in a subjectively unsafe situation waiting in the street. As such, NACTO suggests that bicyclists be placed in line with a curb or parking area. The Irish bicycling guide echoes this, saying the “stacking area” must be clearly visible and not obstruct crossing pedestrians or straight ahead cyclists. A frequent signal cycle may entice cyclists to wait in a design that requires two steps.
Lastly, the Netherlands’ CROW 2007 indicates that simultaneous green signal phases exclusive to cyclists can be provided to allow bicycle left turns on all arms of an intersection. This may be ideal for high cyclist-volume intersections, though it could increase waiting times for all road users. Again, a quick signal cycle may relieve this issue.
More research is needed on the safety effects of these interventions and the impacts of whatever facility is put in place ought to be measured.
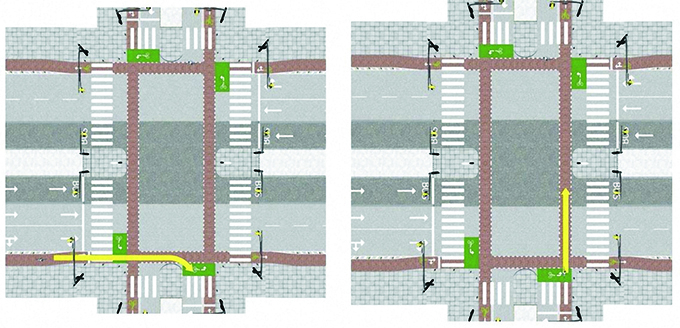
Cyclists should continue straight along the road on a green light, stop in the queue box to the right and wait for the light to change before proceeding on the other street.
Bicyclists conflict with pedestrians embarking and disembarking at bus stops. Special design should accommodate the needs of both. A bike path behind bus stops can help avoid collisions between bicyclists and bus passengers, though if this is not provided priority should be given to pedestrians in some form.
Bike path design should accommodate the needs of both bicyclists and pedestrians at a bus stop.
Figure 6.6 | Bike Safety at Bus Stops Case
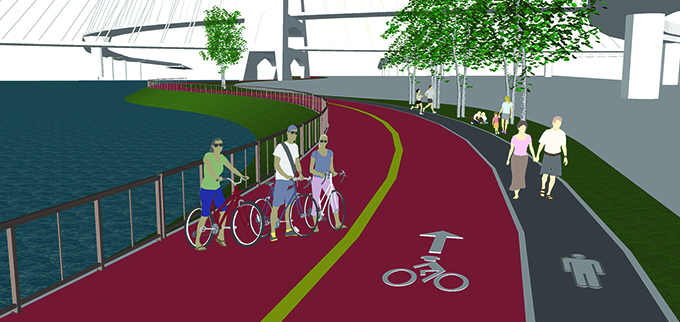
A bus station bypass in Rio de Janeiro, Brazil that raises the bicycle lane to the sidewalk level while bypassing the bus waiting area.
Bicycle signals make crossing intersections safer for bicyclists by clarifying who and when to cross an intersection and by giving bicyclists priority crossing by signal phasing. Push buttons, bike boxes, and colored pavement and markings may be combined with bicycle signals to enhance bicycle crossing safety.
Bicycle signals can be clearly placed to inform when cyclists can cross.
Figure 6.7 | Bicycle Signals Case
A bicycle signal is provided along this protected bicycle lane in Istanbul, Turkey.
Introducing new bicycle infrastructure can help enhance bicycling rates and provide residents the choice to use a form of transport that is incredibly healthy when considering the physical activity benefits. Cities can go beyond safer bicycling lanes to also provide the bicycles themselves through bicycle sharing, which has found success in low- and middle-income countries such as China and Mexico.
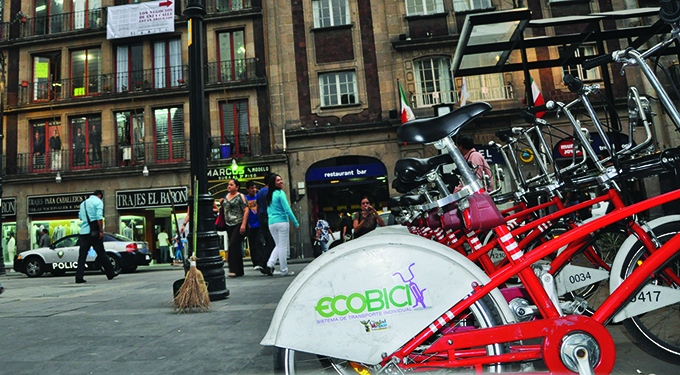
One of the most notable is Mexico City’s Ecobici bike sharing program, which was launched in 2010 and today has an estimated 73,000 users and 27,500 daily trips over 4,000 bikes and 275 stations. In China, the systems are the largest in the world. The bicycle share system in Hangzhou, China has 66,500 bicycles operating from 2,700 stations. Globally, there are now over 500 cities with bicycle sharing systems in place (Hidalgo and Zeng 2013).
Studies of bicycle sharing are showing a potential in providing health benefits. A study of users of Barcelona’s bike sharing system showed that there was near-zero percent increase in risk associated with exposure to air pollution and traffic crashes, but that over twelve lives were saved per year from the physical activity of people switching to more active transport (Rojas-Rueda et al. 2011). A review of bicycle share systems in the United States, Canada, and Europe reveals that bicycle share riders have a lower rate of crash risk than the average bicyclist (Kazis 2011). Experts have noted that this may be because bicycle-share bicycles move at lower speeds, are sturdier, are designed to keep riders in an upright position, have built-in lighting, and are often taken for short trips that may limit exposure.
Further study is needed regarding the safety aspect of bicycle sharing—especially those in Latin America and China—being instituted in countries with higher rates of traffic crashes. It is also important that cities interested in introducing bicycle sharing take actions to improve the safety of infrastructure on streets.
Well-designed public transport is a key component of safer city streets. High-quality public transport provides the safest form of mobility possible, moving more people, more safely than other modes (ETSC 2003; Elvik and Vaa 2009). In many cities, especially in low- and middle-income countries, however, informal mass transport with little oversight (Restrepo Cadavid 2010) is perceived to be unsafe and generally associated with an increased risk of crashes.
For public transport to have a positive impact on safety, it requires a well-organized system and priority. Our research shows that when cities give this priority, they have a better safety impact than conventional or informal transit. Data from the implementation of Bus Rapid Transit (BRT) systems—such as Macrobus in Guadalajara, Transmilenio in Bogotá, and the Janmarg in Ahmedabad—show a significant reduction in crashes and fatalities on their respective corridors.
Research at EMBARQ has focused on identifying risk factors and common crash types on such transitways to provide safer design guidelines. The main safety risks on transit corridors depend on its geometric design rather than the type of technology used (bus or rail) or the region of the world it is in. Most recommendations in this chapter focus on bus systems, which are more widely implemented around the world and are relatively easier to upgrade than other modes. More detailed guidance can be found in the WRI report entitled Traffic Safety on Bus Priority Systems.
Though recommendations discussed here and in other chapters of this guide can also be applied to the design of access points for other public transport, more research is needed on how cities can foster safer access and movement within an integrated transport system.
This chapter illustrates how safety can be improved on bus priority corridors by improved design of:
In its publication Traffic Safety on Bus Priority Systems, EMBARQ provides guidelines for creating safer bus corridors based on research from around the world. Part of the data analysis from this research revealed common types of crashes along bus corridors. This includes the following:
1. Pedestrians in the bus lane
Pedestrians may cross through slow or stalled mixed traffic only to be struck by a bus travelling on a dedicated bus lane. Bus drivers also have little time to react as their view of pedestrians crossing through traffic is often obstructed by the vehicles on the road. This type of crash usually results in fatal injuries.
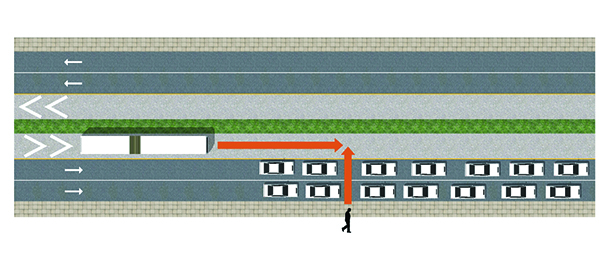
2. Left turns across a bus lane
This is one of the most common types of collision between buses and general traffic when median bus lanes are used. If left turns at intersections are not restricted or controlled, a vehicle when making a left turn cuts across the bus lane and can be struck by a bus going straight through the intersection.
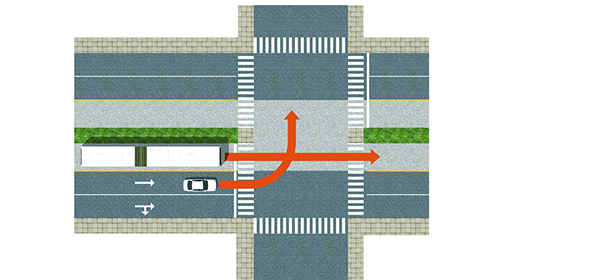
3. General traffic in bus lanes
This is a common crash type when dedicated bus lanes are provided. The lack of a physical barrier between bus lanes and general traffic lanes can allow other vehicles to illegally enter the bus lanes and collide with buses.
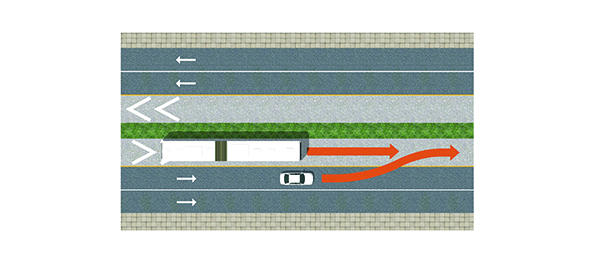
4. Crashes between buses and cyclists
Cyclists sometimes use dedicated bus lanes, because they perceive them to be safer than mixed traffic lanes but can face serious injury when hit by fast moving buses. Cyclists sometimes also attempt evasive maneuvers into other lanes when buses approach, which may cause them to be hit by a vehicle from the opposite direction or lose control and hit the dividers. At curbside bus stops, buses merging into mixed traffic may potentially be dangerous to cyclists.
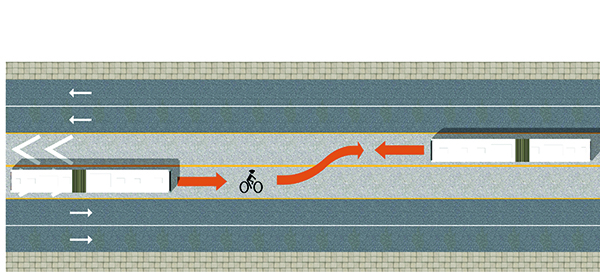
5. Rear end collisions at a bus stop or station
This occurs when a bus is lining up behind another bus at a station platform but is coming in too fast and collides with the bus in front.
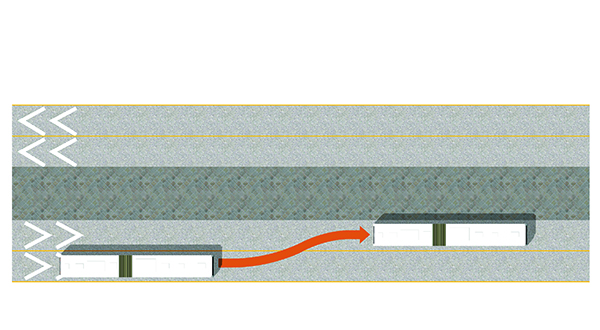
6. Crashes between buses at stations
These crashes occur on multi-lane busways with express lanes. Buses leaving the station and merging onto the express lane collide with buses in the express lane, either traveling through or attempting to access the station. A collision with an express bus is more severe as they travel at higher speeds.
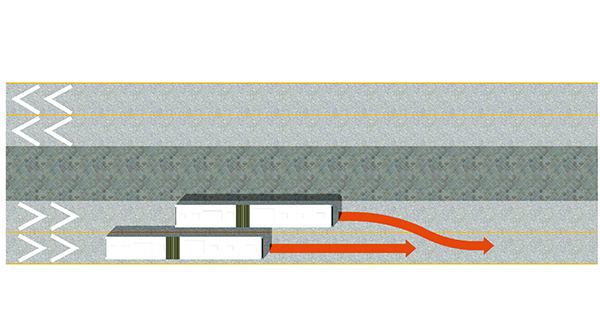
Source:Duduta et al. 2015
The key to ensuring safety on any bus corridor is to keep streets narrow and design simple, tight intersections. The size and complexity of intersections are key predictors of higher crash frequencies on bus corridors.
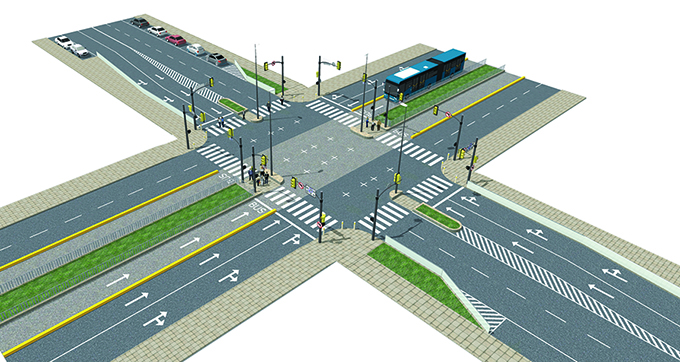
Four-way intersection with a median bus way.
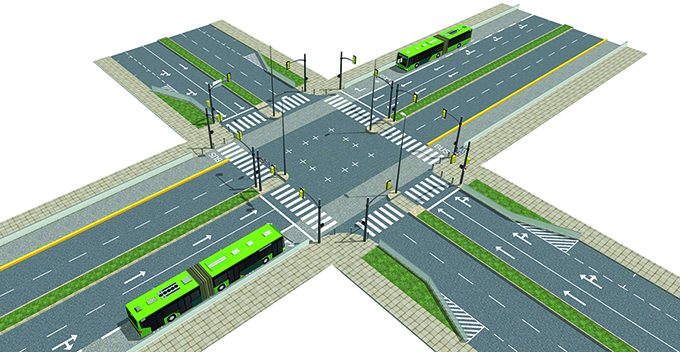
Four-way intersection with curbside bus lanes.
Figure 7.1 | Intersections with Bus Corridors Case
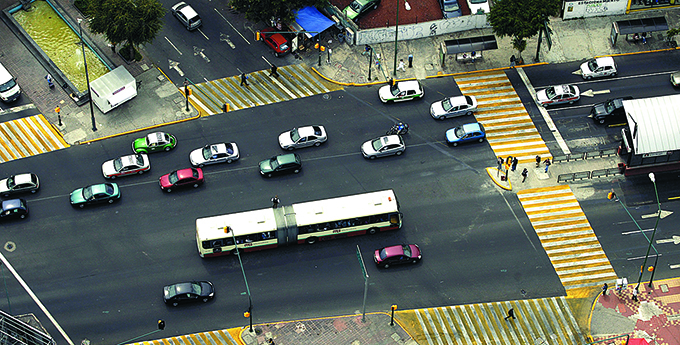
Mexico City’s BRT corridor on Avenida Insurgentes includes a ban on left turns at intersections, leading to fewer conflicts and crashes.
Pedestrian midblock crashes are the most important safety issue on a bus corridor. Busways can become a barrier to pedestrian access if sufficient midblock crossings are not provided. This can also increase the chances of pedestrians crossing without any protection or even jumping over barriers, increasing the likelihood of crashes. Well-designed midblock crossings can mitigate these crashes and improve safety.
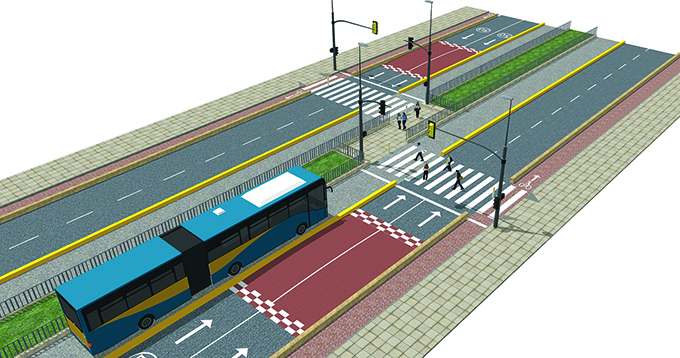
Midblock crossing on an urban arterial.
Figure 7.2 | Midblock Crossings Case
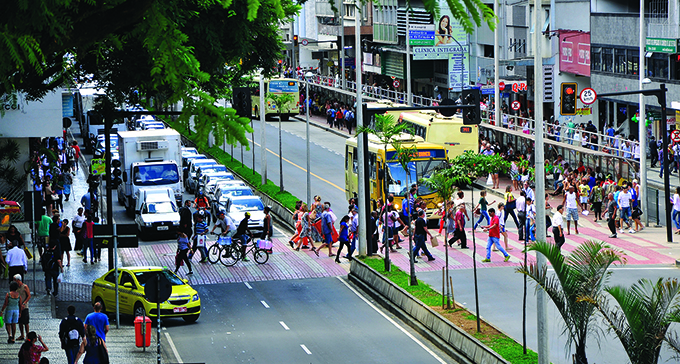
A midblock crossing on a busway in Juiz de Fora, Brazil includes a marked, raised crossing and signalization in a 25 km/hr segment that allows safer passage.
Station design can prevent dangerous traffic movements and improve accessibility and operations. Stations and their surrounding areas have higher pedestrian volumes due to traffic moving to and from stations. This increases the risk of crashes involving pedestrians. Stations near intersections also need to be designed to allow buses to wait or turn at intersections.
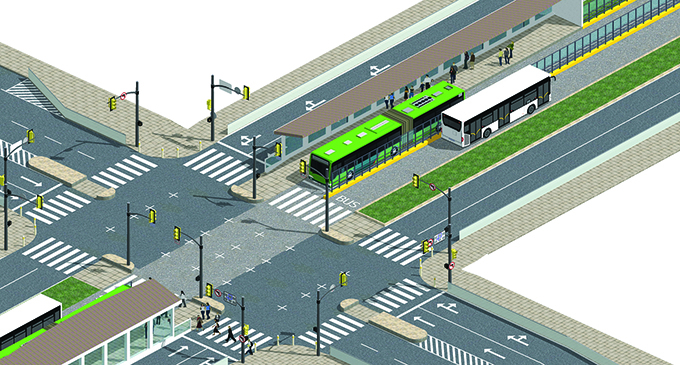
Pedestrian access to a median BRT station.
Figure 7.3 | BRT/Busway Stations Case
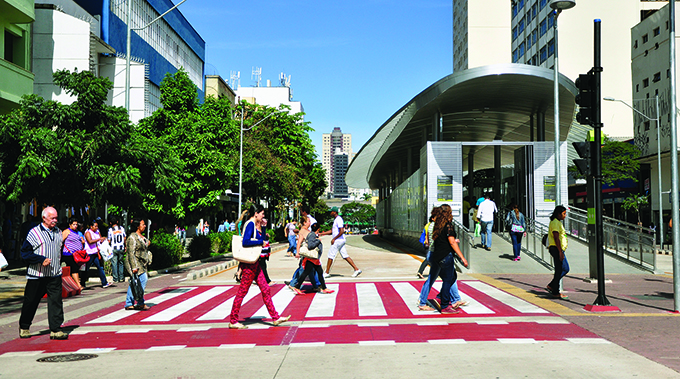
Stations of the MOVE BRT in Belo Horizonte BRT are accessible via clearly marked crossings, signalization, and a ramp into the station that is set back so that passengers can see coming and going vehicles as they exit the station.
The safest transfers between two routes or modes are when passengers do not have to leave the station platform. Integrated transfer points are ideal, but they require a lot of space. In denser cities, transfers may happen across an intersection, requiring design considerations similar to those discussed in the previous sections.
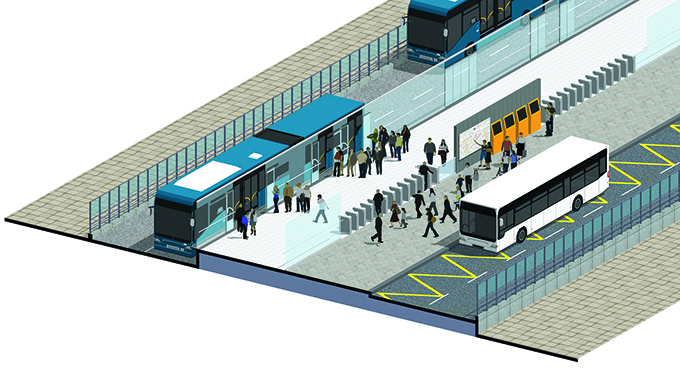
Transfer between a high floor BRT line and conventional bus service.
Figure 7.4 | Terminals and Transfers Case
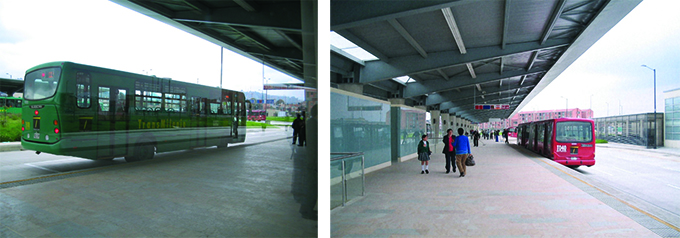
Images show transfers between the Transmilenio BRT and a feeder bus on two sides of the same platform.
This chapter primarily focuses on access to bus stations and does not provide key elements for designing safer tram or light rail corridors or access to these stations. Trams can take on a wide spectrum of route types. Some are completely separated from traffic in underground tunnels or along heavy rail or waterfront corridors. Others are placed along or in the middle of city streets. While this publication does not include detailed guidance on trams, a review of research on street design shows the main issues involve (a) conflicts between vehicles and trams; and (b) pedestrian safety, especially regarding station access.
Vehicle conflicts: mixed traffic is least desirable. Streetcars running at grade on-street have been identified as the least desirable design for light rail systems due to potential conflicts with other modes of transit, which can impede traffic, limit transit speed and reliability, and pose safety risks to both vehicles and pedestrians (Richmond et al. 2014). Dedicated lanes prevent these conflicts and can be ensured through physical barriers such as guard rails or fences that will prevent pedestrians and vehicles from entering the track area. Conflicts also can be found at intersections, especially where turning vehicles may be crossing the path of the tram. This requires separate signals for turning vehicles, though banning left turns would go further in reducing the chance of a tram hitting a turning vehicle (Pecheux and Saporta 2009).
Pedestrian safety. Another large issue with trams is the conflict between vehicles and pedestrians, particularly at station areas. A study from Sweden showed that three-quarters of those injured in bus and tram incidents sustained their injuries at bus or tram stops, or at pedestrian crossings (Hedelin, Bunketorp, and Björnstig 2002). Measures to improve safety include reducing vehicle speeds through speed humps, raised pedestrian crossings, or other traffic calming measures, shortening crossing distances, and ensuring clear visibility at station entries and exits. Horns or bells can alert pedestrians of a coming train. Among other interventions, arms can close off the track area to prevent pedestrians from crossing when trains are passing (Cleghorn 2009).
More research is needed, particularly statistical analysis on the design features that can maximize safety for tram corridors. Many of the issues found with trams appear to be similar to those seen with BRT (Duduta et al. 2015). In any event, road safety audits and inspections are important and will give designers important information in improving traffic safety.
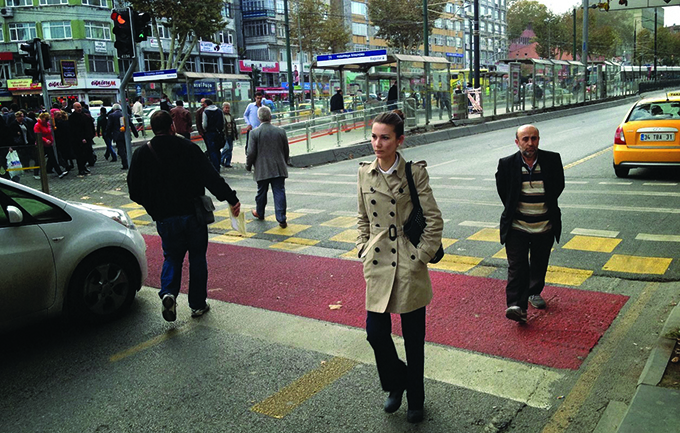
A raised crossing in Istanbul helps give priority to pedestrians at an access point to a tram station.
Urban road safety should be integrated into urban mobility and other city plans—alongside environment, energy, and mobility concerns—within a long-term and sustainable vision.
Across the world, cities have choices to make in how they shape neighborhoods and design streets. Will these choices lead to the pedestrian and bicycle accommodating streets of Copenhagen or the more car-dependent, freeway-oriented past of Atlanta?
Combined with efforts to improve vehicle impact technologies, improved regulations for seatbelt use and drunk-driving laws, safer street and urban design can be provided in new massive housing developments or redevelopment, new cities and urban growth areas, and in rethinking existing streets.
Spread-out cities in the U.S., Canada, and Europe that developed in the late twentieth century are reviewing their own policies, which have promoted a spread-out city with higher traffic fatalities. This realization, however, has taken several decades while a place like Copenhagen is seeing the benefits of 50 years of work to reclaim the city for people. Sustainable urban development—focused on walking, bicycling, and access to mass transport, compact development, mixed land uses, nearby parks and public space, and safely designed roads that slow cars and forgive human error are the key to making this happen.
Urban road safety should be integrated into urban mobility and other city plans—alongside environment, energy, and mobility concerns—within a long-term and sustainable vision. Both authorities and citizens should realize the choices to be made and diligently work together to implement them.
Continuous safety performance monitoring and research is needed to acquire the necessary knowledge to support decision making. Cities need to create their own solutions, catered to their own local context, and measure them to obtain the desired impact.
This report is meant to guide cities on the basic elements of how to make community and street design safer so cities can create these solutions, and measure them for replication. In this pilot version, a variety of solutions and evidence is provided, along with examples to road test in cities. The next version will incorporate all of the reviews and input received over this road-test process. This guide also hopes to inspire the creation of local- or country-level guidance that can better reflect the context of those places—and reduce traffic fatalities and serious injuries. By doing so, cities can become not only safer for all their residents, but healthier, more sustainable places to live.
1. Tap into the expertise of all road users. To build a successful safe and friendly city, consultations with all the road users are imperative. Different users are the experts on their own needs.
2. Engage multiple sectors. Government cannot do it alone. Encourage public and private partners from multiple sectors to take part in the effort to be more inclusive of all road users, both as a business opportunity and a moral imperative. Museums, theaters, grocery stores, banks, pharmacies, churches, and block associations can all be leaders in creating safe and friendly cities.
3. Recognize that a safe travel environment is a contributor to the economy.
4. Ensure that pedestrians, bicyclists, transit and bus passengers know about existing opportunities and resources.
5. Adopt a “safe-in-everything” approach to community planning and the design process. Redesign street intersections with the safety of all road users in mind. Focus on areas near shops and services and on areas with high rates of pedestrian injuries. Add public seating on streets in accordance with location recommendations from pedestrians.
6. Advocate for improvements in public transportation. Focus on making transportation safe, accessible, and welcoming to all users. Good lighting, clear signage, and courteous drivers can be just as important as having an appropriate infrastructure in place.
7. Increase accessibility to opportunities that promote health and socialization. Expand efforts to make parks, walking trails, swimming pools, beaches, recreation centers, and public events accessible and welcoming to all groups. Offer fitness and recreational programming designed for and of interest to all users.
8. Last but not least, plan for safety through mobility plans, city plans, traffic safety action plans, and other plans to prioritize safety in city designs.
Angel, Shlomo. Planet of cities. Cambridge, MA: Lincoln Institute of Land Policy, 2012.
American Planning Association, ed. Planning and urban design standards. John Wiley & Sons, 2006.
Association for Safe International Road Travel (ASIRT). N.d. “Road Crash Statistics.” (accessed October 2013).
Becerril, L. C., M. H. Medina, B. D. Serrano, B. A. Escamilla, A. H. Cantarell, and H. R. Lopez. 2008. “Geographic Information System for the atention and prevention of traffic accidents in Mexico City.” 9a Conferencia mundial sobre prevención de lesiones y promoción de la seguridad. Mexico City: Instituto Nacional De Salud Publica.
Bellefleur, O., and F. Gagnon. 2011. “Urban Traffic Calming and Health Literature Review.” Québec : National Collaborating Center for Healthy Public Policy.
Berthod, C. 2011. “Traffic Calming, Speed Humps and Speed Cushions.” Paper presented at the 2011 Annual Conference of the Transportation Association of Canada, Edmonton, Alberta.
Better Streets San Francisco. 2010. San Francisco Better Streets Plan: Policies and Guidelines for the Pedestrian Realm. San Francisco: San Francisco Planning Department.
Bjornskau, T. 1993. “TOI-rapport 216.” Oslo: Transportokonomisk institutt.
Black, J. L., and J. Macinko. 2008. “Neighborhoods and obesity.” Nutrition Review 66 (1): 2–20.
Bliss, Tony, and Jeanne Breen. 2009. Country Guidelines for the Conduct of Road Safety Management Capacity Reviews and the Specification of Lead Agency Reforms, Investment Strategies, and Safe System Projects. Washington DC: World Bank Global Road Safety Facility.
Booth, K.M., M. M. Pinkston, and W.S.C. Poston. 2005. “Obesity and the Built Environment.” Journal of the American Dietetic Association 105 (5S): 110–117.
Borthagaray, A. (dir.). 2009. “Ganar la calle: compartir sin dividir.” Buenos Aires: Infinito. (accessed October 2013).
Bunn, F., T. Collier, C. Frost, K. Ker, I. Roberts, and R. Wentz. 2003. “Traffic calming for the prevention of road traffic injuries: systematic review and meta-analysis.” Injury Prevention 9: 200–204.
Center for Science and Environment (CSE). 2009. Footfalls: Obstacle Course to Livable Cities. New Delhi: Center for Science and Environment.
Centre d’études sur les réseaux, les transports, l’urbanisme et les constructions publiques (CERTU). 2009. “Le profil en travers, outil du partage des voieries urbaines.” Lyon: CERTU. (accessed Oct 2013).
Changcheng, L., G. Zhang, J. Zhang, and H.Zheng. 2010. “First engineering practice of traffic calming in Zhaitang Town in China.” In International Conference on Optoelectronics and Image Processing Vol. 1: 565–568. Haiko, China: IEEE.
Chias Becerril, L., and A. Cervantes Trejo. 2008. “Diagnóstico Espacial de los Accidentes de Transito en el Distrito Federal.” (in Spanish). Mexico City: Secretaría de Salud.
Chong, S., R. Poulos, J. Olivier, W. L. Watson, and R. Grzebieta. 2010. “Relative injury severity among vulnerable non-motorised road users: comparative analysis of injury arising from bicycle–motor vehicle and bicycle–pedestrian collisions.” Accident Analysis & Prevention 42 (1): 290–329.
City of Copenhagen. 2010. “Copenhagen City of Cyclists: Bicycle Account.” Copenhagen: City of Copenhagen.
City of New Haven. 2010. New Haven Complete Streets Manual. New Haven: City of New Haven.
City of Philadephia. 2012. Philadelphia Complete Streets Design Handbook. Philadelphia: Mayor’s Office of Transportation and Utilities.
Cleghorn, Don. 2009. “Improving pedestrian and motorist safety along light rail alignments.” Transportation Research Board 13. Washington, D.C.: Transportation Research Board.
Cörek Öztas, Cigdem, and Merve Aki. 2014. Istanbul Historic Peninsula Pedestrianization Project. Istambul: EMBARQ Turkey.
CROW. 2007. Design Manual for Bicycle Traffic. Netherlands: National Information and Technology Platform for Transport, Infrastructure and Public Space.
CTS México. 2010a. “Hacia Ciudades Competitivas Bajas en Carbono (C2C2), México.” (accessed October 2013).
CTS México. 2010b. Manual Desarrollo Orientado al Transporte Sustentable (DOTS), México. (accessed October 2013).
CTS México. 2011. Manual Espacio Público y Vida Pública (EPVP), México. (accessed October 2013).
Dalkmann, H., and C. Brannigan. 2007. “Transport and Climate Change.” In: Sustainable Transport: A Sourcebook for Policy-makers in Developing Cities. (Module 5e) Germany: GTZ.
D.C. Department of Transportation. 2009. Manual for Design and Engineering. Washington, DC: District of Columbia.
DeJoy, David M. “An examination of gender differences in traffic accident risk perception.” Accident Analysis & Prevention 24, no. 3 (1992): 237-246.
Dimitriou, H. T., and R. Gakenheimer. 2012. Urban transport in the developing world. Cheltenham: Edward Elgar Publishing Ltd.
Diogenes, M. C., and L. A. Lindau. 2010.“Evaluation of Pedestrian Safety at Midblock crossings, Porto Alegre, Brazil.” Transportation Research Record 2193: 37–43.
Duduta, N., C. Adriazola-Steil, D. Hidalgo, L.A. Lindau, and R. Jaffe. 2012. “Understanding the Road Safety Impact of High Performance BRT and Busway Design Features.” Transportation Research Record 2317: 8–16.
Duduta, N., C. Adriazola, and D. Hidalgo. 2012. “Sustainable Transport Saves Lives: Road Safety.” Issue Brief. Washington, DC: World Resources Institute.
Duduta, N., L.A. Lindau, and C. Adriazola-Steil. 2013. “Using Empirical Bayes to Estimate the Safety Impact of Transit Improvements in Latin America.” Paper presented at the Road Safety and Simulation International Conference , Rome, 23-25 October, 2013.
Duduta, N., C. Adriazola-Steil, C. Wass, D. Hidalgo, L. A. Lindau, and V. S. John. 2015.“Traffic Safety on Bus Priority Systems: Recommendations for Integrating Safety into the Planning, Design, and Operation of Major Bus Routes.” Washington DC: EMBARQ/ World Bank Group.
Dumbaugh, E. 2005. “Safe streets, livable streets.” Journal of the American Planning Association 71 (3): 283–300.
Dumbaugh, E., and R. Rae. 2009. “Safe Urban Form: Revisiting the Relationship Between Community Design and Traffic Safety.” Journal of the American Planning Association 75 (3): 309–329.
Dumbaugh, E., and W. Li. 2011. 2011. “Designing for the Safety of Pedestrians, Cyclists, and Motorists in Urban Environments.” Journal of the American Planning Association 77 (1): 69–88.
Elvik, R., A. Hoye, and T. Vaa. 2009. The Handbook of Road Safety Measures. Bingley: Emerald Group Publishing.
European Commission (EC). 2004. “City structure: København, Danmark.” The Urban Audit. (accessed October 2013)
European Commission (EC). 2013. “On the Implementation of Objective 6 of the European Commission’s Policy Orientations on Road Safety 2011-2020—First Milestone Towards an Injury Strategy.” Commission Staff Working Document. Brussels: EC.
European Transport Safety Council (ETSC). 2003. “Transport Safety Performance in the EU: A Statistical Overview.” Brussels: ETSC.
European Transport Safety Council (ETSC). 2014. “Integrating Safety into the EU’s Urban Transport Policy: ETSC’s Response to the EC’s Urban Mobility Package.” Belgium: ETSC.
Ewing, R., and E. Dumbaugh. 2010. “The Built Environment and Traffic Safety: A Review of Empirical Evidence.” Injury Prevention 16: 211–212.
Ewing, R., and R. Cervero. 2010. “Travel and the Built Environment: A Meta-Analysis.” Journal of the American Planning Association 76: 265-294.
Ewing, R., R. A. Schieber, and C.V. Zegeer. 2003. “Urban Sprawl as a Risk Factor in Motor Vehicle Occupant and Pedestrian Fatalities.” American Journal of Public Health 93: 1541–1545.
Federal Highway Administration (FWHA). 2006. “Bikesafe: Bicycle Countermeasure Selection System.” (accessed October 2013)
Federal Highway Administration (FWHA). 2006. “Lesson 3: Pedestrian and Bicyclist Safety.” Federal Highway Administration University Course on Bicycle and Pedestrian Transportation.
FHWA Safety. 2010. “Appendix B. Research Problem Statements.” In Pedestrian Safety Strategic Plan: Recommendations for Research and Product Development. (accessed October 2013)
FHWA Safety. 2013. “Traffic Calming Countermeasures Library.” Safer Journey. (accessed October 2013)
Frumkin, H, L. Frank, and R. Jackson. 2004. The Public Health Impacts of Sprawl. Washington, DC: Island Press.
Georgia DOT. 2003. Pedestrian and Streetscape Guide. Atlanta: Georgia DOT.
Gould, M. 2006. “Life on the open road.” The Guardian, April 12. (accessed October 2013)
Harnen, S., R. S. Radin Umar, S. V. Wong, and W. Hashim. 2004. “Development of prediction models for motorcycle crashes at signalized intersections on urban roads in Malaysia.” Journal of Transportation and Statistics 7 (2/3): 27–39.
Hedelin, Annika, O. Bunketorp, and U. Björnstig. 2002. “Public transport in metropolitan areas—a danger for unprotected road users.” Safety Science 40 (5): 467–477.
Hidalgo, Dario, and Cornie Huizenga. 2013. “Implementation of Sustainable Urban Transport in Latin America.” Research in Transportation Economics 40 (1): 66–77.
Hidalgo, Dario, and Heshuang Zeng. 2013. On the Move: Pushing Sustainable Transport from Concept to Tipping Point. Cityfix. Washington DC: EMBARQ.
Hoehner, C., L. Ramirez, M. Elliot, S. Handy, and R. Brownson.2005. “Perceived and objective environmental measures and physical activity among urban adults.” American Journal of Preventive Medicine 28 (2S2): 105–116.
Huzevka, P. 2005. “Traffic Management in Sweden’s Neighbourhoods: Examples from Gothenburg.” Institute of Transportation Engineers.
Institute of Transportation Engineers (ITE). 2010. Designing Walkable Urban Thoroughfares: A Context Sensitive Approach. (accessed October 2013)
Institute of Transportation Engineers (ITE). 2013. Traffic Calming Measures. (accessed October 2013)
ITDP México and I-CE. 2011. Manual Ciclociudades. Mexico: ITDP México.
Jacobs, A. B. 1995. Great Streets. Boston: The MIT Press.
Jacobsen, P. L. 2003. “Safety in numbers: more walkers and bicyclists, safer walking and bicycling.” Injury Prevention 9: 205–209.
Jost, Graziella, Marco Popolizio, Richard Allsop, and Vojtech Eksler. 2009. 2010 on the Horizon: 3rd Road Safety PIN Report. Brussels: European Transport Safety Council.
Kazis, Noah. “From London to D.C., Bike-Sharing Is Safer Than Riding Your Own Bike.” Streetsblog New York City. June 16, 2011. Accessed May 22, 2015.
King, M., J. Carnegie, and R. Ewing. 2003. “Pedestrian Safety Through a Raised Median and Redesigned Intersections.” Transportation Research Record 1828: 56–66.
Knoblauch, R. L., B. H. Tustin, S. A. Smith, and M. T. Pietrucha. 1988. Investigation of Exposure Based Pedestrian Accident Areas: Crosswalks, Sidewalks, Local Streets and Major Arterials. Center for Applied Research, Inc., Falls Church, VA: Federal Highway Administration.
Kraay, J.H. & Bakker, M.G. (1984). Experimenten in verblijfsruimten; Verslag van onderzoek naar de effecten van infrastructurele maatregelen op verkeersongevallen. R-84-50. SWOV, Leidschendam, 1984.
Leather, J., H. Fabian, S. Gota, and A. Mejia. 2011. “Walkability and Pedestrian Facilities in Asian Cities: State and Issues.” ADB Sustainable Development Working Paper Series. Manila: Asian Development Bank (ADB).
Li, Yan-Hong, Yousif Rahim, Lu Wei, Song Gui-Xiang, Yu Yan, Zhou De Ding, Zhang Sheng-Nian, Zhou Shun-Fu, Chen Shao-Ming, and Yang Bing-Jie. “Pattern of traffic injuries in Shanghai: implications for control.” International journal of injury control and safety promotion 13, no. 4 (2006): 217-225.
Litman, Todd. 2014. “A New Transit Safety Narrative.” Journal of Public Transportation 17 (4): 121–142.
Los Angeles County Department of Public Health. 2011. Model Design Manual for Living Streets. Los Angeles County. (accessed October 2013)
Marshall, W. E., and N. W. Garrick. 2011. “Evidence on Why Bike-Friendly Cities Are Safer for All Road Users.” Environmental Practice 13 (1): 16–27.
Masud Karim, Dewan. 2015. “Narrower Lanes, Safer Streets.” Paper accepted for Canadian Institute of Transportation Engineers Conference and Annual General Meeting, Regina, 7-10 June, 2015.
Minikel, E. 2012. “Cyclist safety on bicycle boulevards and parallel arterial routes in Berkeley, California.” Accident Analysis & Prevention 45: 241–247.
Monsere, C., and J. Dill. 2010. “Evaluation of Bike Boxes at Signalized Intersections. Final Draft.” Portland: Oregon Transportation Research and Education Consortium.
Mundell, James, and D. Grigsby. “Neighborhood traffic calming: Seattle’s traffic circle program.” Road Management & Engineering Journal (1998).
National Association of City Transportation Officials (NACTO). 2013. Urban Street Design Guide. Washington, DC: Island Press.
National Transport Authority, Ireland (NTA). 2011. National Cycle Manual (NCM). Dublin: National Transport Authority.
New Climate Economy (NCE). 2014. Better Growth, Better Climate: New Climate Economy Report. Global Commission on the Economy and Climate.
New York City Department of Transportation (NYC DOT). 2010a. “New York City Pedestrian Safety Study and Action Plan.” New York: NYC DOT.
New York City Department of Transportation (NYC DOT). 2010b. New York Street Design Manual. New York City: NYC DOT.
New York City Department of Transportation (NYC DOT). 2012. Measuring the Street: New Metrics for 21st Century Streets. New York: NYC DOT.
Nguyen, Ngoc Quang, M. H. P. Zuidgeest, van den FHM Bosch, R. V. Sliuzas, and van MFAM Maarseveen. “Using accessibility indicators to investigate urban growth and motorcycles use in Ha Noi City, Vietnam.” In Proceedings of the Eastern Asia Society for Transportation Studies, vol. 9. 2013.
Nicol, D. A., D. W. Heuer, S. T. Chrysler, J. S. Baron, M. J. Bloschock, K. A. Cota, P. D. Degges, et al. 2012. “Infrastructure Countermeasures to Mitigate Motorcyclist Crashes in Europe.” No. FHWA-PL-12-028. Washington, DC: Federal Highway Administration.
Oxley, J., B. Corben, B. Fildes, and M. O’Hare. 2004. “Older Vulnerable Road Users—Measures to Reduce Crash and Injury Risk.” Melbourne: Monash University Accident Research Centre.
Paez, Fernando and Gisela Mendez. 2014. “Mexico City’s New Mobility Law Shifts Focus Towards People, Not Cars.” (accessed December 10, 2014)
Pai, M., A. Mahendra, R. Gadgil, S. Vernikar, R. Heywood, and R. Chanchani. 2014. “Motorized Two-Wheelers in Indian Cities: A Case Study of the City of Pune, India.” Mumbai: EMBARQ India.
Passmore, J., T.H.T. Nguyen, A.L. Mai, D.C. Nguyen, and P.N. Nguyen. 2010. “Impact of mandatory motorcycle helmet wearing legislation on head injuries in Viet Nam: results of a preliminary analysis.” Traffic injury prevention 11 (2): 202–206.
Pecheux, K., and H. Saporta. 2009. “Light rail vehicle collisions with vehicles at signalized intersections. A synthesis of transit practice. TCRP synthesis 79.” Transportation Research Board, Washington DC.
Pedestrian and Bicycle Information Center. N.d. “Walking Info.” (accessed October 2013)
Pozueta Echavarri, J. 2009. “La ciudad paseable: Recomendaciones para el diseño de modelos urbanos orientados a los modos no motorizados.” Madrid: Departamento de Urbanismo y Ordenación del Territorio, Escuela Técnica Superior de Arquitecura, Universidad Politécnica de Madrid.
Radin Umar, R. S. 1996. “Accident Diagnostic System with Special Reference to Motorcycle Accidents in Malaysia.” Ph. D. Thesis, University of Birmingham, England.
Radin Umar, R. S., G. M. Mackay, and B. L. Hills. 1995. “Preliminary analysis of exclusive motorcycle lanes along the federal highway F02, Shah Alam, Malaysia.” Journal of IATSS Research 19 (2): 93–98.
Radin Umar, R. S., G. M. Mackay, and Brian L. Hills. “Preliminary analysis of exclusive motorcycle lanes along the federal highway F02, Shah Alam, Malaysia.” Journal of IATSS Research 19, no. 2 (1995): 93-98.
Restrepo Cadavid, P. 2010. “Energy for Megacities: Mexico City Case Study.” London: World Energy Council.
Reynolds, C. C., M. A. Harris, K. Teschke, P. A. Cripton, and M. Winters. 2009. “The impact of transportation infrastructure on bicycling injuries and crashes: a review of the literature.” Environmental Health 8 (1): 47.
Richmond, Sarah A., Linda Rothman, Ron Buliung, Naomi Schwartz, Kristian Larsen, and Andrew Howard. 2014. “Exploring the impact of a dedicated streetcar right-of-way on pedestrian motor vehicle collisions: A quasi experimental design.” Accident Analysis & Prevention 71: 222–227.
Rodrigues, E. MS., A. Villaveces, A. Sanhueza, and J. A. Escamilla-Cejudo. 2013. “Trends in fatal motorcycle injuries in the Americas, 1998–2010.” International journal of injury control and safety promotion 21: 1–11.
Rojas-Rueda, D., A. de Nazelle, M. Tainio, and M. J. Nieuwenhuijsen. 2011. “The Health Risks and Benefits of Cycling in Urban Environments Compared with Car use: Health Impact Assessment Study.” BMJ (Clinical Research Ed.) 343: d4521. doi:10.1136/bmj.d4521.
Rosen, E., and U. Sander. 2009. “Pedestrian Fatality Risk as a Function of Car Impact Speed.” Accident Analysis and Prevention 41: 536–542.
Sarmiento, O., A. Torres, E. Jacoby, M. Pratt, T. L. Schmid, and G. Stierling. 2010. “The Ciclovia-recreativa: a mass recreational program with public health potential.” Journal of Physical Activity and Health 7 (2): S163–S180.
Schepers, J. P., P. A. Kroeze, W. Sweers, and J. C. Wüst. 2011. “Road factors and bicycle–motor vehicle crashes at unsignalized priority intersections.” Accident Analysis & Prevention 43 (3): 853–861.
Schmitt, A. 2013. “The Rise of the North American Protected Bike Lane.” Momentum Mag July 31: 59.
Smart Growth America. 2010a. “National Complete Streets Coalition: FAQ.” (accessed October 2013)
Smart Growth America. 2010b. “National Complete Streets Coalition: Safety.” (accessed October 2013)
Sohadi, R., R. Umar, M. Mackay, and B. Hills. 2000. “Multivariate analysis of motorcycle accidents and the effects of exclusive motorcycle lanes in Malaysia.” Journal of Crush Prevention and Injury Control 2 (1): 11–17.
Sousanis, John. “World Vehicle Population Tops 1 Billion Units.” WardsAuto. August 15, 2011. Accessed May 22, 2014.
Sul, Jaehoon. 2014. Korea’s 95% Reduction in Child Traffic Fatalities: Policies and Achievements. Seoul: The Korean Transport Institute (KOTI).
Summala, Heikki, Eero Pasanen, Mikko Räsänen, and Jukka Sievänen. 1996. “Bicycle accidents and drivers’ visual search at left and right turns.” Accident Analysis & Prevention 28 (2): 147–153.
Swift, P., D. Painter, and M. Goldstein. 1997. “Residential Street Typology and Injury Accident Frequency .” Denver: Congress for the New Urbanism.
Tao, W., S. Mehndiratta, and E. Deakin. 2010. “Compulsory Convenience? How Large Arterials and Land Use Affect Midblock Crossing in Fushun, China.” Journal of Transport and Land Use 3 (3): 61–82.
Teschke, K., M. A. Harris, C. Reynolds, M. Winters, S. Babul, M. Chipman, M. D. Cusimano et al. 2012. “Route infrastructure and the risk of injuries to bicyclists: A case-crossover study.” American Journal of Public Health 102 (12): 2336–2343.
Thompson, S. R., C. M. Monsere, M. Figliozzi, P. Koonce, and G. Obery. 2013. “Bicycle-Specific Traffic Signals: Results from a State-of-the-Practice Review.” 92nd Annual Meeting of the Transportation Research Board. Washington DC: Transportation Research Board.
Tolley, R. 2003. “Providing For Pedestrians: Principles and Guidelines for Improving Pedestrian Access To Destinations and Urban Spaces.” Victoria: Department of Infrastructure.
U.K. Department of Transport. 1997. “Traffic Advisory Leaflet 12/97 Chicane Schemes.” (accessed October 2013)
U.K. Department of Transport. 2007. Manual for Streets. London: Thomas Telford Publishing. (accessed October 2013).
UNEP Transport Unit: Regina Orvañanos Murguía. 2013. Share the Road: Design Guidelines for Non Motorised Transport in Africa. Nairobi, Kenya: UNEP.
“UNICEF: An Urban World.” Unicef Urban Population Map. 2012. Accessed January 26, 2015.
Van Houten, Ron, Richard A. Retting, Charles M. Farmer, and Joy Van Houten. “Field evaluation of a leading pedestrian interval signal phase at three urban intersections.” Transportation Research Record: Journal of the Transportation Research Board 1734, no. 1 (2000): 86-92.
Vasconcellos, E. A. 2013. “Risco no Trânsito, Omissão e Calamidade: Impactos do Incentivo à Motocicleta no Brasil.” Sao Paulo, Brazil: Instituto Movimento.
Victoria Transport Policy Institute (VTPI). 2012. “Roadway Connectivity: Creating More Connected Roadway and Pathway Networks.” TDM Encyclopedia. (accessed October 2013)
Voigt, K. H., and N. Steinman. 2003. “Design Changes for Livable Urban Streets.” 2nd Urban Street Symposium. Anaheim: Transportation Research Board.
Wang, S. L., Z. L. Liu, J. F. Guo, and Yanyan Chen. 2009. “Research on Bicycle Safety at Intersection in Beijing.” In Proceedings of the 2008 International Conference of Chinese Logistics and Transportation Professionals, Chengdu, China, pp. 4739–4744.
Wedagamaa, D.M. P., R. N. Bird, and A. V. Metcalfe. 2006. “The influence of urban land-use on non-motorised transport casualties.” Accident Analysis & Prevention 38 (6): 1049–1057.
Wegman, F. 1993. “Road Safety in Residential Areas: The Dutch Experience.” Yokohama: PIARC Committee 13 Road Safety Meeting.
Welle, Ben, and Wei Li. 2015. EMBARQ technical note: “Traffic fatality rates in cities across the globe”. (unpublished)
World Bank. 2013. “Road Safety Management Capacity Reviews and Safe System Projects.” Washington, DC: World Bank Global Road Safety Facility.
World Health Organization (WHO). 2003. “Road traffic injuries Fact sheet N°358.” Geneva: WHO. (accessed October 2013)
World Health Organization (WHO). 2009. “Global status report on road safety.” Department of Violence & Injury Prevention & Disability (VIP). Geneva: WHO.
World Health Organization (WHO). 2010. “Data Systems: a road safety manual for decision-makers and practitioners.” Geneva: WHO.
World Health Organization (WHO). 2013. “Pedestrian Safety: A road safety manual for decision-makers and practitioners.” Geneva: WHO.
Yan, X., M. Ma, H. Huang, M. Abdel-Aty, and C. Wu. 2011. “Motor vehicle–bicycle crashes in Beijing: Irregular maneuvers, crash patterns, and injury severity.” Accident Analysis & Prevention 43 (5): 1751–1758.
Yi, M., K. Feeney, D. Adams, C. Garcia, and P. Chandra. 2011.“Valuing cycling–evaluating the economic benefits of providing dedicated cycle ways at a strategic network level.” In Australasian Transport Research Forum 2011 Proceedings, pp. 28–30.
York, I., S. Ball, and J. Hopkin. 2011. “Motorcycles in bus lanes. Monitoring of the second TfL trial.” Report CPR 1224. Crowthorne, UK: Transport Research Laboratory.
Zegeer, Charles V., and Max Bushell. “Pedestrian crash trends and potential countermeasures from around the world.” Accident Analysis & Prevention 44, no. 1 (2012): 3-11.
Ben Welle is a Senior Associate for Mobility and Global Manager of Health and Road Safety for WRI Ross Center for Sustainable Cities.
Contact: bwelle@wri.org
Qingnan Liu is a former research analyst with WRI Ross Center for Sustainable Cities. She is currently a Senior Analyst at BCG - The Boston Consulting Group.
Wei Li is a research analyst and transport planner at WRI China and WRI Ross Center for Sustainable Cities. He helps with road safety projects in China and Southeast Asia.
Contact: WLi@wri.org
Claudia Adriazola-Steil is Global Director of Health and Road Safety for WRI Ross Center for Sustainable Cities.
Contact: cadriazola@wri.org
Robin King is the Director of Knowledge Capture and Collaboration at WRI Ross Center for Sustainable Cities.
Contact: rking@wri.org
Claudio Sarmiento is a former staff of WRI Mexico and WRI Ross Center for Sustainable Cities. He is currently a researcher and PHD candidate in urban design at the University of Toronto.
Marta Obelheiro is the Road Safety Coordinator at WRI Brasil and WRI Ross Center for Sustainable Cities, with a focus on public transportation, urban development and traffic safety projects.
Contact: mobelheiro@wri.org
Download an English PDF copy of the report.
Download a Chinese PDF copy of the report.
Download a Portuguese PDF copy of the report.
Download a Spanish PDF copy of the report.
Download a Thai PDF copy of the report.
Download a Turkish PDF copy of the report.
Download a Vietnamese PDF copy of the report.
Cover, pg. 10, 36, 44, 61 (bottom), 64, 70 (middle), 74, 76, 83, 84 EMBARQ Brasil; pg. ii–iii Christopher Fynn; pg. 2 VvoeVale; pg. 5 (top: right, bottom: left), 28, 61 (top), 82, 85 EMBARQ Sustainable Urban Mobility by WRI; pg. 5 (top: left), 9 Benoit Colin/WRI; pg. 5 (top: middle), 26, 27, 31, 33, 34, 37, 40, 46, 47, 48, 51,56, 57, 61 (middle), 69 (bottom), 72, 86 Ben Welle; pg. 5 (bottom: middle); pg. 5 (bottom: right) Meena Kadri; pg. 20 Jess Kraft/Shutterstock; pg. 23 Julie Lindsay; pg. 24 bharat.rao; pg. 35 Dylan Passmore; pg. 38 Google, INEGI; pg. 39 Martti Tulenheimo; pg. 43 Miguel Rios; pg. 49 NACTO; pg. 52 Aaron Minnick; pg. 55 Gilmar Altamirano; pg. 58 Steve Hoge; pg. 59 Safe Kids Korea; pg. 60 Ajay Gautam; pg. 62 New York City; pg. 63 Wrote; pg. 67 City of Curitiba; pg. 69 (top) Jason Margolis, PRI’s The World; pg. 75 EMBARQ Turkey; pg. 70 (bottom) Enrique Penalosa; pg. 71 JT; pg. 77 Cheng Liu; pg. 87 Alex Proimos; pg. 88 Francisco Anzola
The authors thank the following individuals for their valuable guidance and critical reviews: Lotte Bech, Himadri Das, Nicolae Duduta, Skye Duncan, Eric Dumbaugh, Rejeet Matthews, Matthew Roe, Henrique Torres, Ellen Townsend, Carsten Wass, and George Yannis. The authors also thank the following experts and colleagues for their advice and support for this report and related activities regarding urban design and transport and traffic safety: Hyacinth Billings, Annie Chang, Benoit Colin, Çiğdem Çörek Öztas¸, Holger Dalkmann, Ani Dasgupta, Carrie Dellesky, Mariana Gil, Dario Hidalgo, Tolga İmamoğlu, Vineet John, Carni Klirs, Erika Kulpa, Clayton Lane, Luis Antonio Lindau, Rafaela Machado, Brenda Medeiros, Gisela Mendez, Marco Priego, Paula Santos Rocha, Asis Subedi, Juan Miguel Velasquez, and Stephen Vikell. A special thanks to Nicolae Duduta for his expertise and advice throughout the process, and contribution of many of the drawings presented in the report. Design support and drawings were also provided by Asis Subedi, Vineet John, Rafaela Machado, Virginia Tavares, and Qianqian Zhang.
The guidance provided in this report is informed by existing resources from the international to city level that includes street design guides and standards, safety guidelines for traffic calming, and manuals for cycling, pedestrian facilities, and more. These include:
WRI is a global research organization that works closely with leaders to turn big ideas into action to sustain a healthy environment—the foundation of economic opportunity and human well-being.
Natural resources are at the foundation of economic opportunity and human well-being. But today, we are depleting Earth’s resources at rates that are not sustainable, endangering economies and people’s lives. People depend on clean water, fertile land, healthy forests, and a stable climate. Livable cities and clean energy are essential for a sustainable planet. We must address these urgent, global challenges this decade.
Natural resources are at the foundation of economic opportunity and human well-being. But today, we are depleting Earth’s resources at rates that are not sustainable, endangering economies and people’s lives. People depend on clean water, fertile land, healthy forests, and a stable climate. Livable cities and clean energy are essential for a sustainable planet. We must address these urgent, global challenges this decade.
COUNT IT
We start with data. We conduct independent research and draw on the latest technology to develop new insights and recommendations. Our rigorous analysis identifies risks, unveils opportunities, and informs smart strategies. We focus our efforts on influential and emerging economies where the future of sustainability will be determined.
CHANGE IT
We use our research to influence government policies, business strategies, and civil society action. We test projects with communities, companies, and government agencies to build a strong evidence base. Then, we work with partners to deliver change on the ground that alleviates poverty and strengthens society. We hold ourselves accountable to ensure our outcomes will be bold and enduring.
SCALE IT
We don’t think small. Once tested, we work with partners to adopt and expand our efforts regionally and globally. We engage with decision-makers to carry out our ideas and elevate our impact. We measure success through government and business actions that improve people’s lives and sustain a healthy environment.
WRI Ross Center for Sustainable Cities works to make urban sustainability a reality. Global research and on-the-ground experience in Brazil, China, India, Mexico, Turkey and the United States combine to spur action that improves life for millions of people.
Based on longstanding global and local experience in urban planning and mobility, WRI Sustainable Cities uses proven solutions and action-oriented tools to increase building and energy efficiency, manage water risk, encourage effective governance and make the fast-growing urban environment more resilient to new challenges.
Aiming to influence 200 cities with unique research and tools, WRI Sustainable Cities focuses on a deep cross-sector approach in four megacities on two continents, and targeted assistance to 30 more urban areas, bringing economic, environmental and social benefits to people in cities around the globe.
Web: WRIcities.org
Blog: TheCityFix.com
Twitter: Twitter.com/WRIcities
Each World Resources Institute report represents a timely, scholarly treatment of a subject of public concern. WRI takes responsibility for choosing the study topics and guaranteeing its authors and researchers freedom of inquiry. It also solicits and responds to the guidance of advisory panels and expert reviewers. Unless otherwise stated, however, all the interpretation and findings set forth in WRI publications are those of the authors.
World Resources Institute
10 G Street NE Suite 800
Washington, DC 20002, USA
Phone +1 (202) 729-7600
Fax +1 (202) 729-7686
ISBN 978-1-56973-866-5